Most traders who use Fair Value Gaps are using them wrong. They see a three-candle imbalance, draw a box, and wait for price to return. Sometimes it works. More often, price blows right through — and they take a loss on a setup they thought was solid.
The problem isn't the concept. The problem is context.
What a Fair Value Gap Actually Is
A Fair Value Gap (FVG) forms when price moves so aggressively in one direction that the wicks of the first and third candles in a three-candle sequence don't overlap. That gap — the void between those two wicks — represents an imbalance where institutional orders were filled at speed, with no opposing liquidity to slow them down.
The market has a mechanical tendency to return to these zones. Not because of magic. Because resting orders, unfilled positions, and algorithmic rebalancing pull price back to re-test the area where the initial impulse began.
That much most traders understand. What they miss: not every FVG is worth trading.
Why Most FVG Setups Fail
A random FVG on a 15-minute chart, in the middle of a range, with no confluence — that's just noise with a box drawn around it. Price revisits it because it revisits everything eventually. There's no edge there.
High-probability FVGs share two characteristics.
1. Zone Strength Relative to Volatility
Not all gaps are created equal. A tiny imbalance on a volatile pair has little significance. A gap that spans more than 1× the current ATR represents a genuine institutional imbalance — one large enough that the move had real momentum behind it.
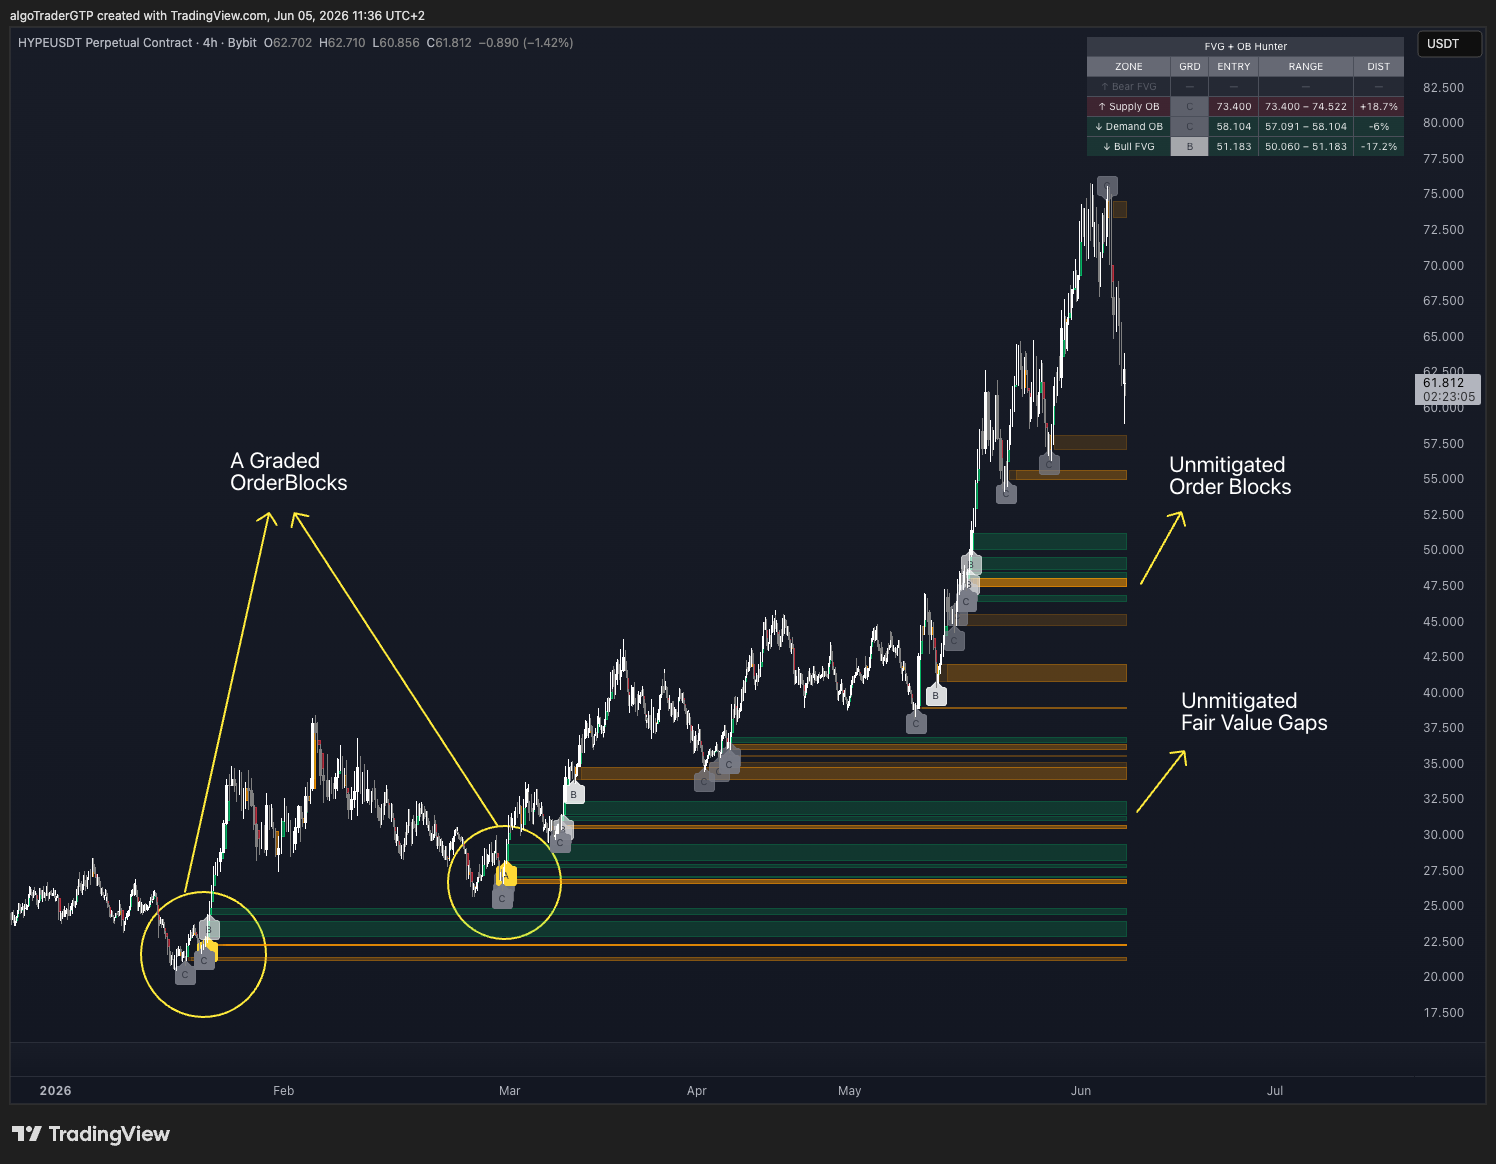
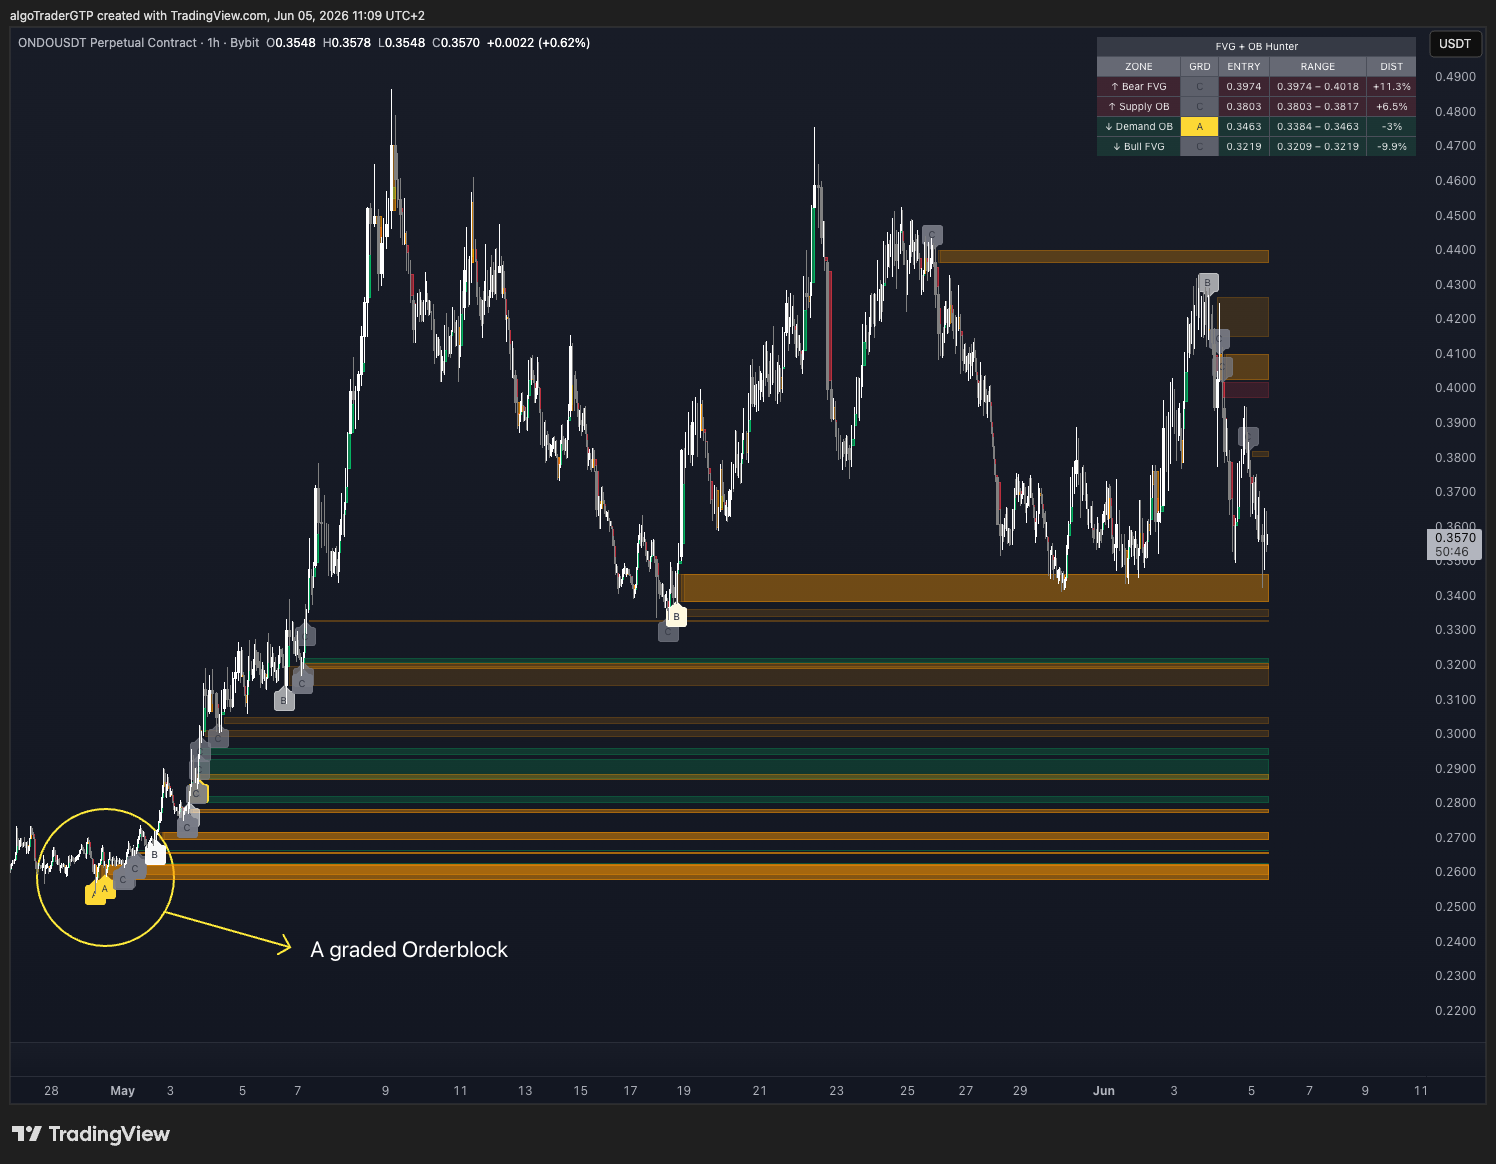
Zone grading measures this directly. Divide zone size by ATR(14) and you get a ratio that classifies each zone:
- Grade A (≥1.0× ATR) — significant imbalance, strong reaction potential
- Grade B (≥0.5× ATR) — moderate, worth watching at confluence
- Grade C (<0.5× ATR) — minor, treat as noise unless part of a larger structure
A-grade zones are where reversals actually hold. C-grade zones are where traders get stopped out waiting for reactions that never come.
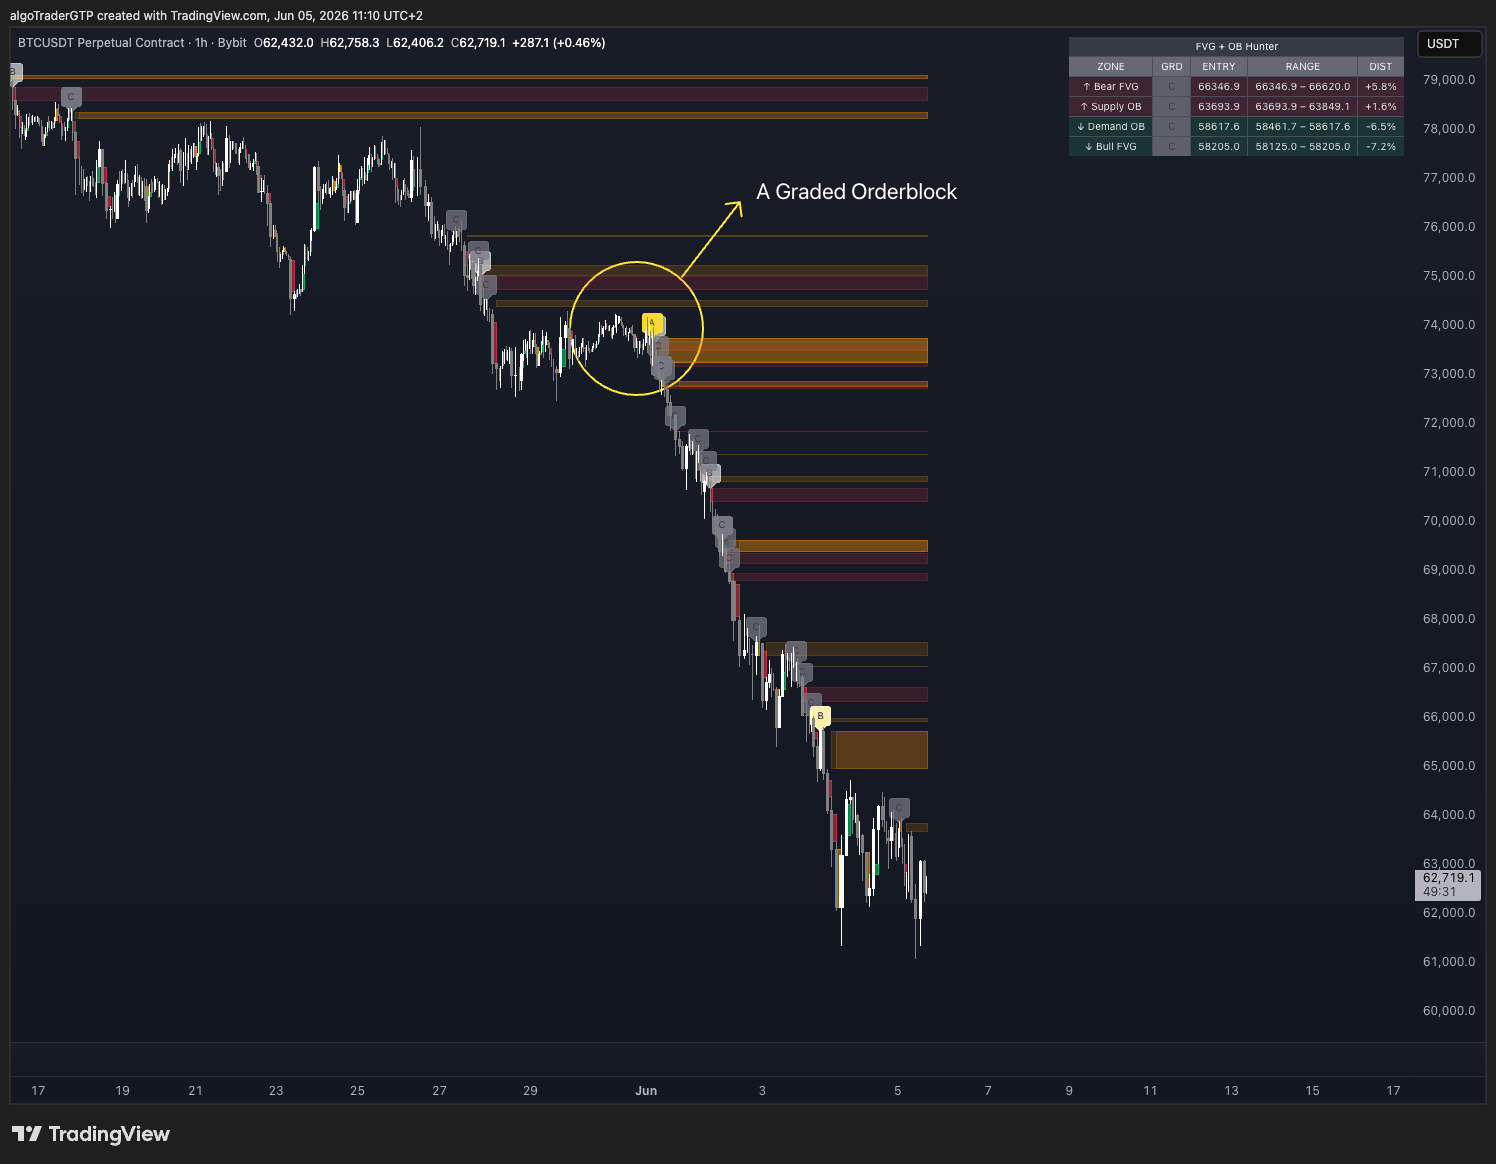
2. Order Block Confluence
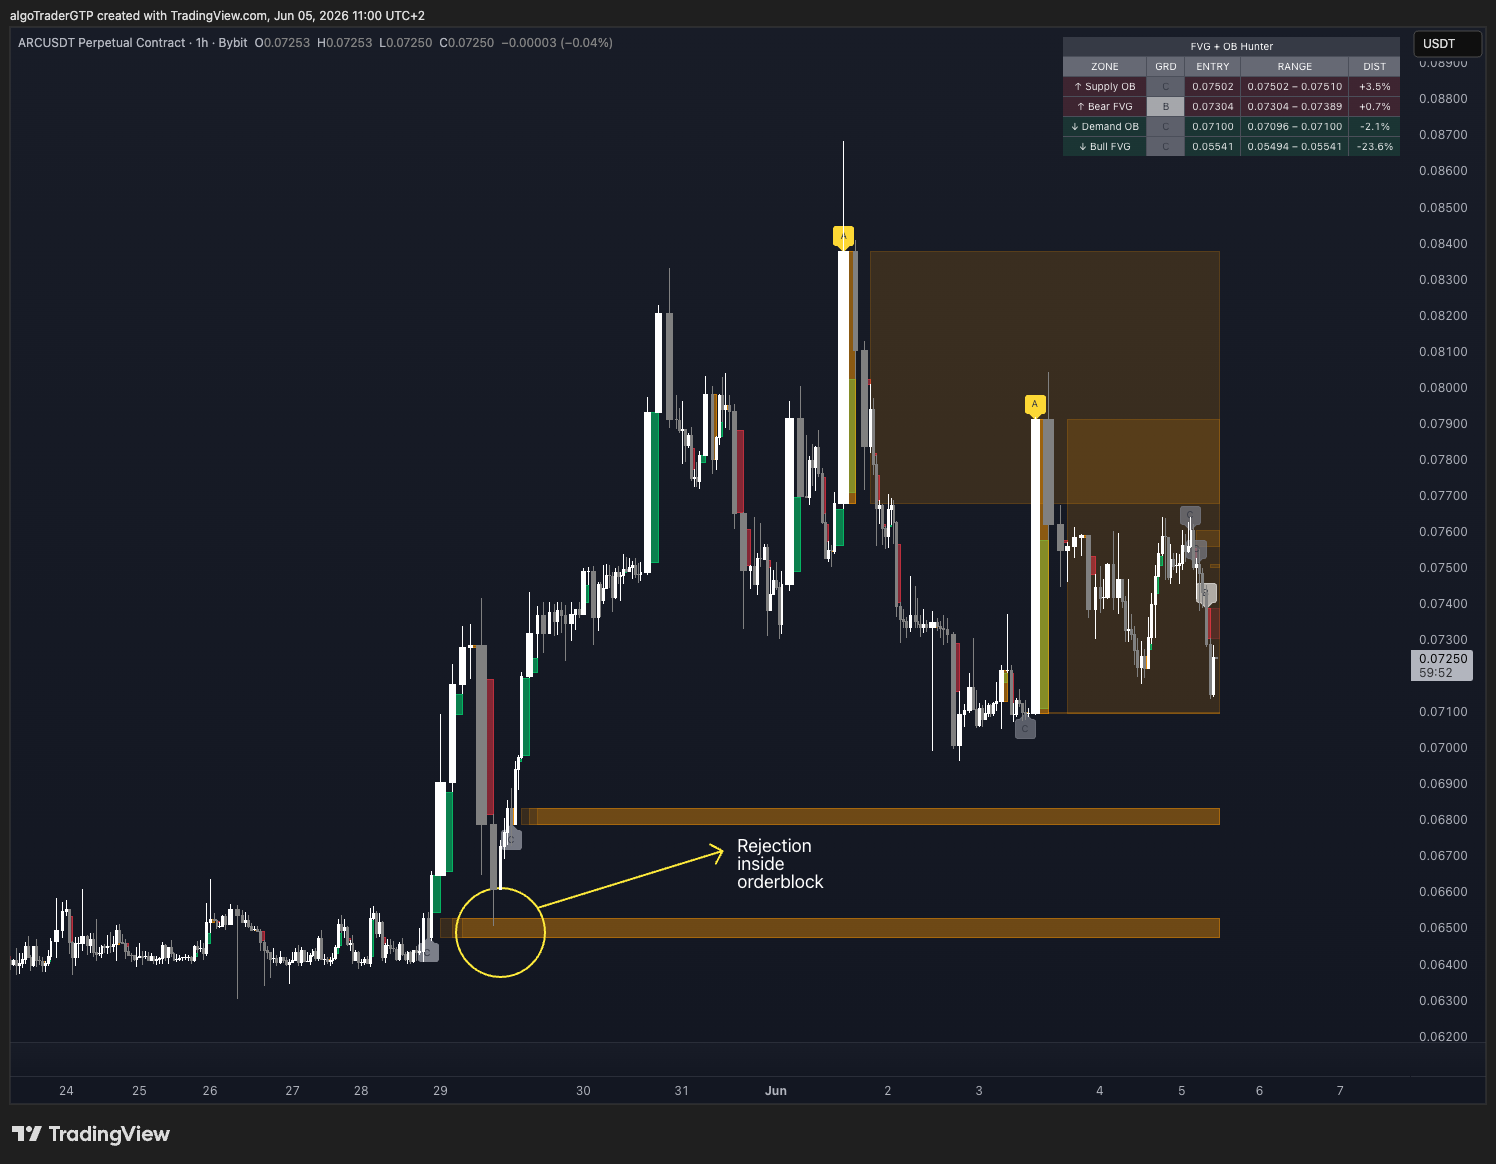
An Order Block is the last opposing candle before a significant institutional move. It marks the price level where institutions placed their bulk orders before the impulse — and where they are likely to defend price again when it returns.
When a FVG forms within an Order Block zone, you have a double layer of confluence. The OB marks where institutions entered. The FVG marks the exact void they left behind. Price returning to that area hits both levels simultaneously — and that's where the strongest reactions occur.
The setup worth trading: FVG nested inside or directly adjacent to an Order Block, at a higher-timeframe structure level. The OB filters low-quality FVGs. The FVG gives you the precision entry. The HTF structure gives you the reason.
Two Setups That Consistently Work
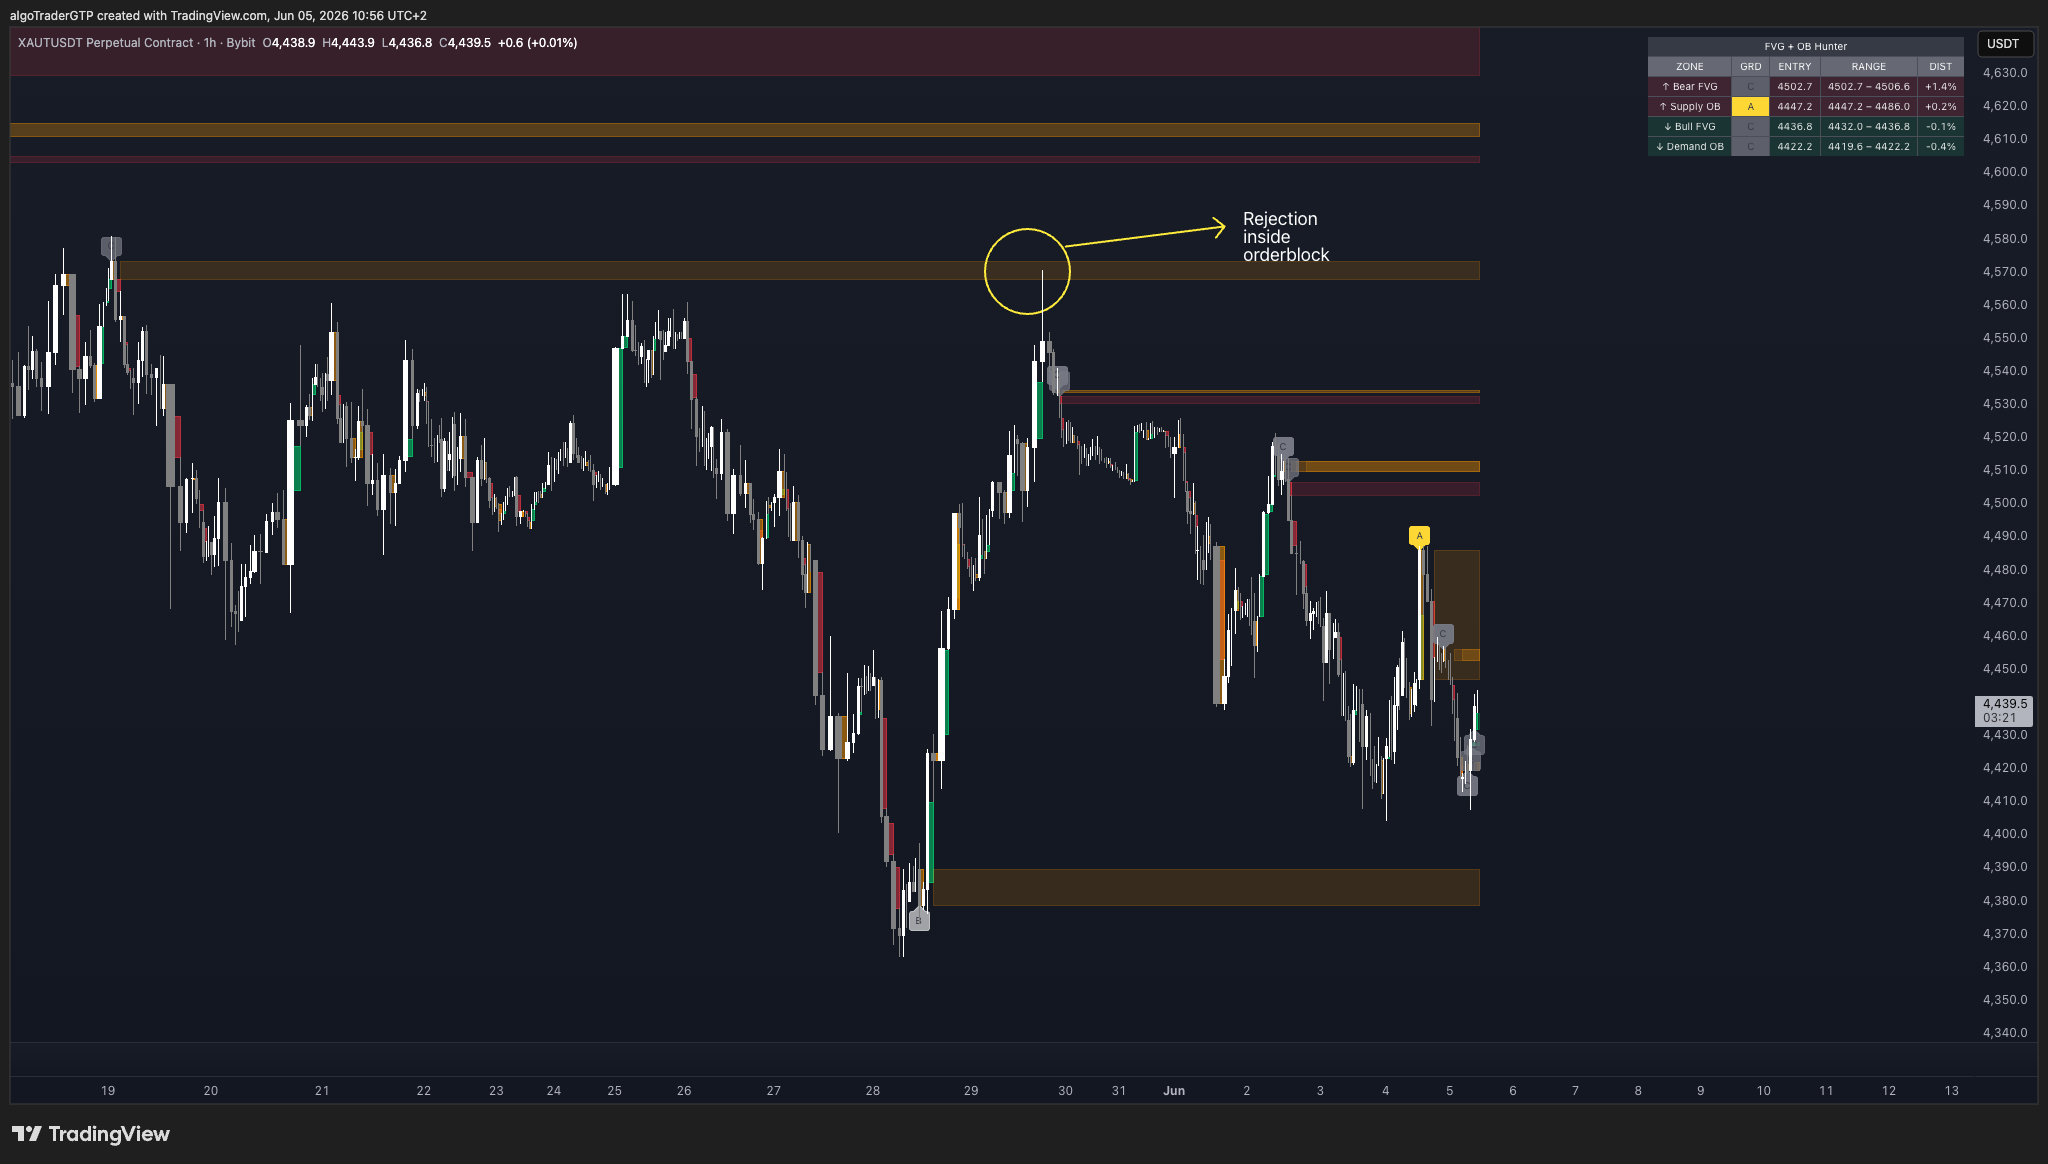
Setup 1: FVG Inside an Order Block
Mark your Order Block from the last opposing candle before the move. If price creates a FVG as it launches out of that OB, the FVG mid-point becomes your entry zone on the return. Stop goes below the OB low (bullish) or above the OB high (bearish).
This is the cleanest ICT entry model because the OB filters out low-quality FVGs. If there's no OB in the same area, the FVG is lower priority.
Setup 2: FVG at a Higher-Timeframe Structure Level
Drop to your working timeframe (15m or 1H) and identify active FVGs. Then check the daily or weekly for major OBs or liquidity zones. When a lower-timeframe FVG sits inside a higher-timeframe structure zone, that's where institutions are likely to defend price.
The HTF level is the reason. The LTF FVG is the trigger. You need both.
The Manual Problem
If you've tried to apply this manually, you know the challenge: managing FVGs across multiple timeframes, tracking which are still live, watching for Order Block overlaps, and catching the return in real time.
Most traders mark a FVG, step away, and miss the entry entirely. Or they're watching five charts and can't process the confluence fast enough. Or they're staring at a mitigated zone — one that was invalidated two bars ago — waiting for a reaction that already happened.
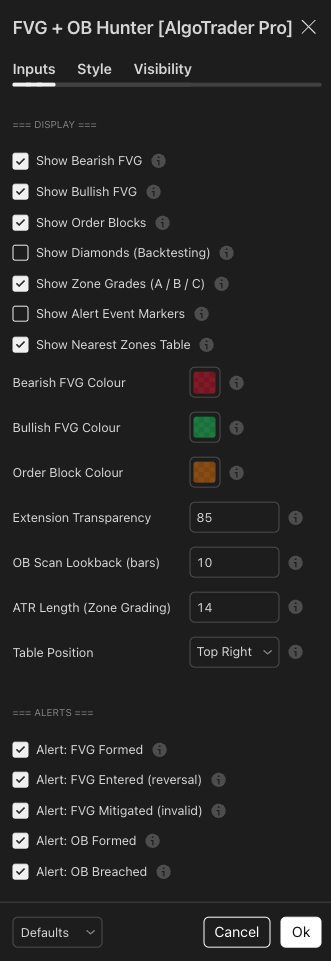
What FVG + OB Hunter Does
FVG + OB Hunter automates the entire workflow:
- Detects every Bullish and Bearish FVG the moment it forms
- Identifies the Supply and Demand Order Block alongside each FVG
- Grades every zone A/B/C by strength relative to ATR(14)
- Extends zones forward bar by bar — dead zones remove themselves
- Shows the nearest active zone above and below price in a live summary table, with grade, entry level, and distance %
- Fires alerts when a zone forms, when price enters, and when a zone is mitigated — each with symbol, direction, and exact price levels
The concept is ICT. The execution is automated.