You build a strategy. The equity curve climbs in a clean, confident line. You go live — and the curve flattens, or worse. Nothing is broken and you didn't get unlucky. The gap between a backtest and live trading is real, it is measurable, and once you know its four causes you can shrink it on purpose.
This is a walkthrough of where backtests quietly inflate — and the testing habits that make your live results track the curve you actually validated.
The Gap Is Normal — the Goal Is to Shrink It
Every honest live system underperforms its backtest a little. Markets move, spreads widen, fills aren't perfect. A small, expected gap is the cost of doing business. The problem is the large gap — the strategy that printed money on history and bleeds in real time. That gap is almost always built in during testing, long before a single live order is sent.
Here are the four places it hides.
Reason 1 — Lookahead Bias and Temporal Leakage
This is the biggest and the sneakiest. Lookahead bias is when your backtest uses information it could not have known at the moment of the trade — a value from the future leaking into a past decision.
- Same-bar execution. Entering on the close of the very candle that triggered your signal — when in reality you only know that close once the bar is finished and the move is gone.
- Repainting indicators. A signal that looks perfect in hindsight because the indicator redrew itself after the fact. Live, it never fires where the backtest said it did.
- Normalizing on the full dataset. Scaling or selecting features using statistics computed over the whole history — including data from after the trade.
The fix is discipline about time: act only on closed bars, execute on the next bar's open, and never let any calculation see a value it wouldn't have had in the moment.
Reason 2 — Data Quality
A backtest is only as honest as the candles it runs on. Survivorship bias (testing only the coins or tickers that still exist), gaps and bad ticks, mismatched timezones, and adjusted-vs-raw prices all quietly tilt results in your favor. Clean, continuous, point-in-time data is unglamorous and it is most of the battle. If you can't trust the inputs, the curve is fiction no matter how good the logic looks.
Reason 3 — The Costs You Didn't Model
Backtests love to assume a perfect fill at the exact price, with zero cost. Live trading charges you for everything:
- Slippage — the difference between the price you wanted and the price you got, worst exactly when you need the fill most.
- Fees and funding — small per trade, decisive across thousands of them, especially for higher-frequency systems.
- Latency and partial fills — the gap between signal, order, and execution, and the orders that only fill halfway.
Add realistic, even pessimistic, assumptions for all three. A strategy whose edge survives conservative costs is one worth trading; an edge that only exists at zero cost never existed.
Reason 4 — Overfitting to the Past
Give yourself enough parameters and you can fit any history perfectly — you will have built a beautiful description of the past with no power over the future. The tells are familiar: dozens of tuned inputs, a curve that only shines on one specific date range, and performance that collapses the moment you nudge a setting. Fewer parameters, grounded in how price actually behaves, generalize far better than a finely curve-fit machine.
How to Test So Live Looks Like the Backtest
- Hold out data you never touch. Build on one period, then test once on a later, unseen period. If it falls apart out-of-sample, it was overfit.
- Walk it forward. Re-optimize on a rolling window and trade the next window — repeatedly. It mirrors how you'd actually run the system.
- Model costs pessimistically. Add slippage, fees, and funding, and require the edge to survive them.
- Act on closed bars only. No same-bar fills, no repainting, execute next-bar — kill the leakage at the source.
- Paper-trade before real size. Run it live, small, and compare the live fills to what the backtest expected. That delta is your real edge.
This is educational, not financial advice. Backtested and walk-forward results are statistical — past performance never guarantees future results. The point of honest testing is better risk decisions, not a promise of returns.
Where Signals Fit
Rigorous testing is the foundation — but it is work, and not everyone wants to build and validate a system from scratch. That is the complement, not the replacement: tools and signals that are built on structural, mechanical rules you can actually reason about.
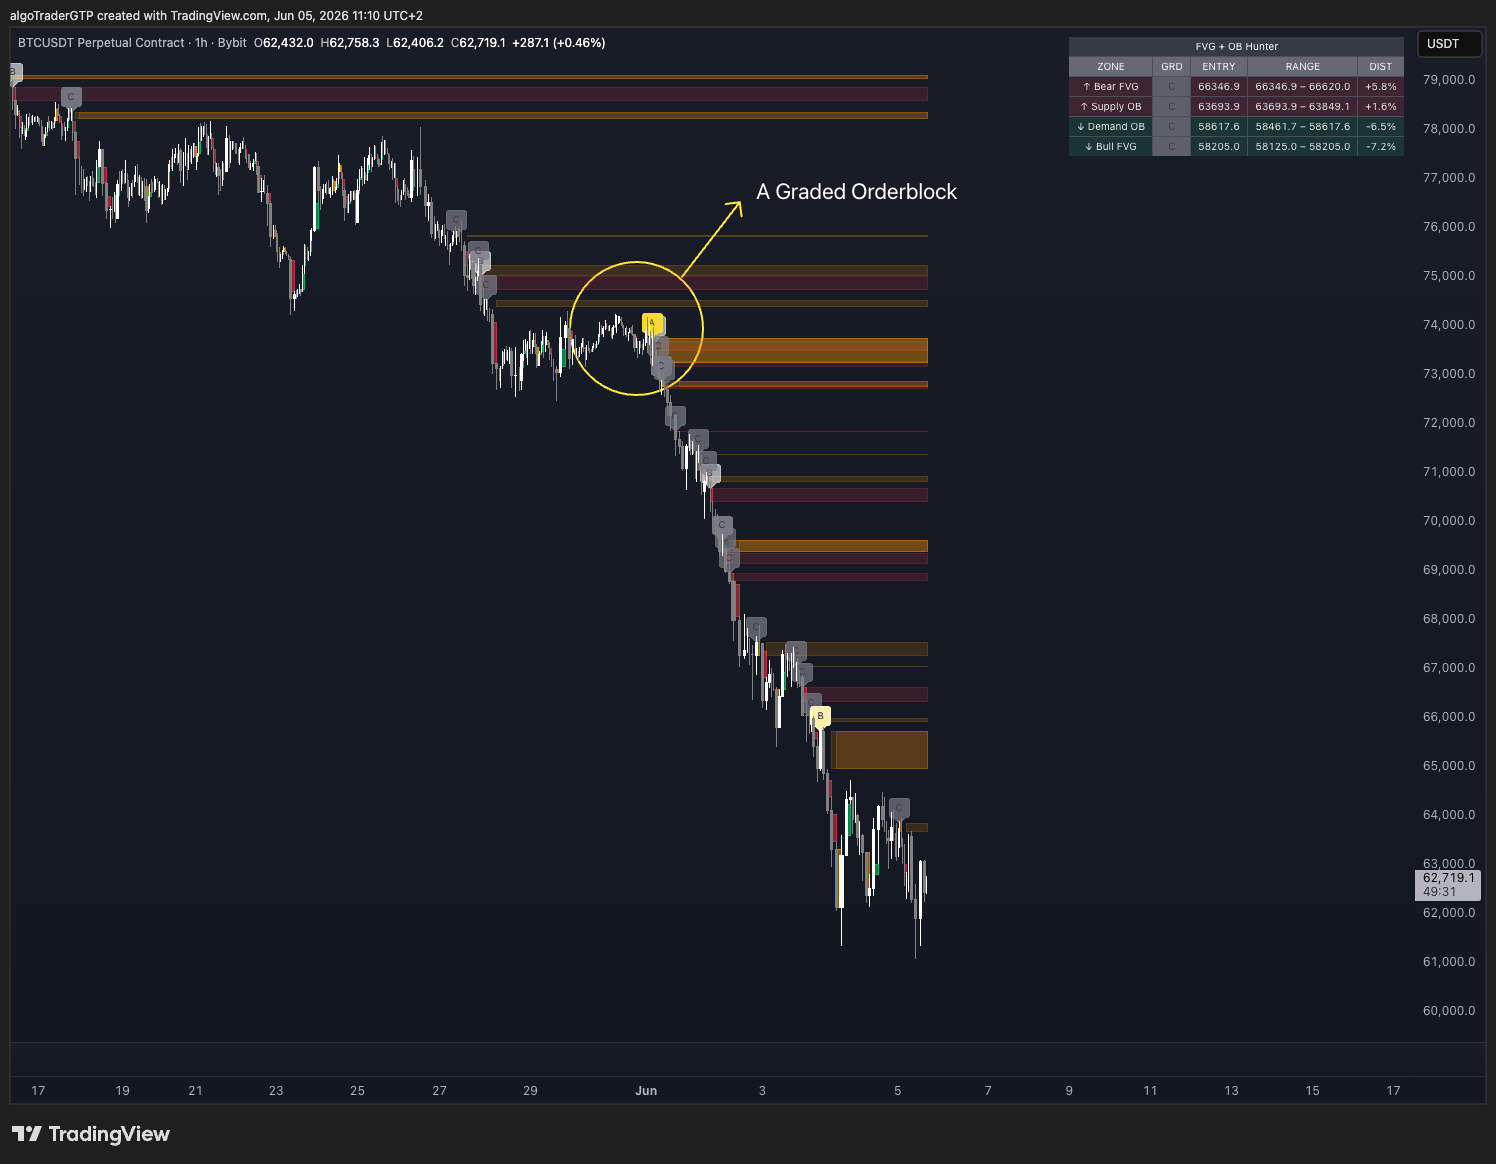
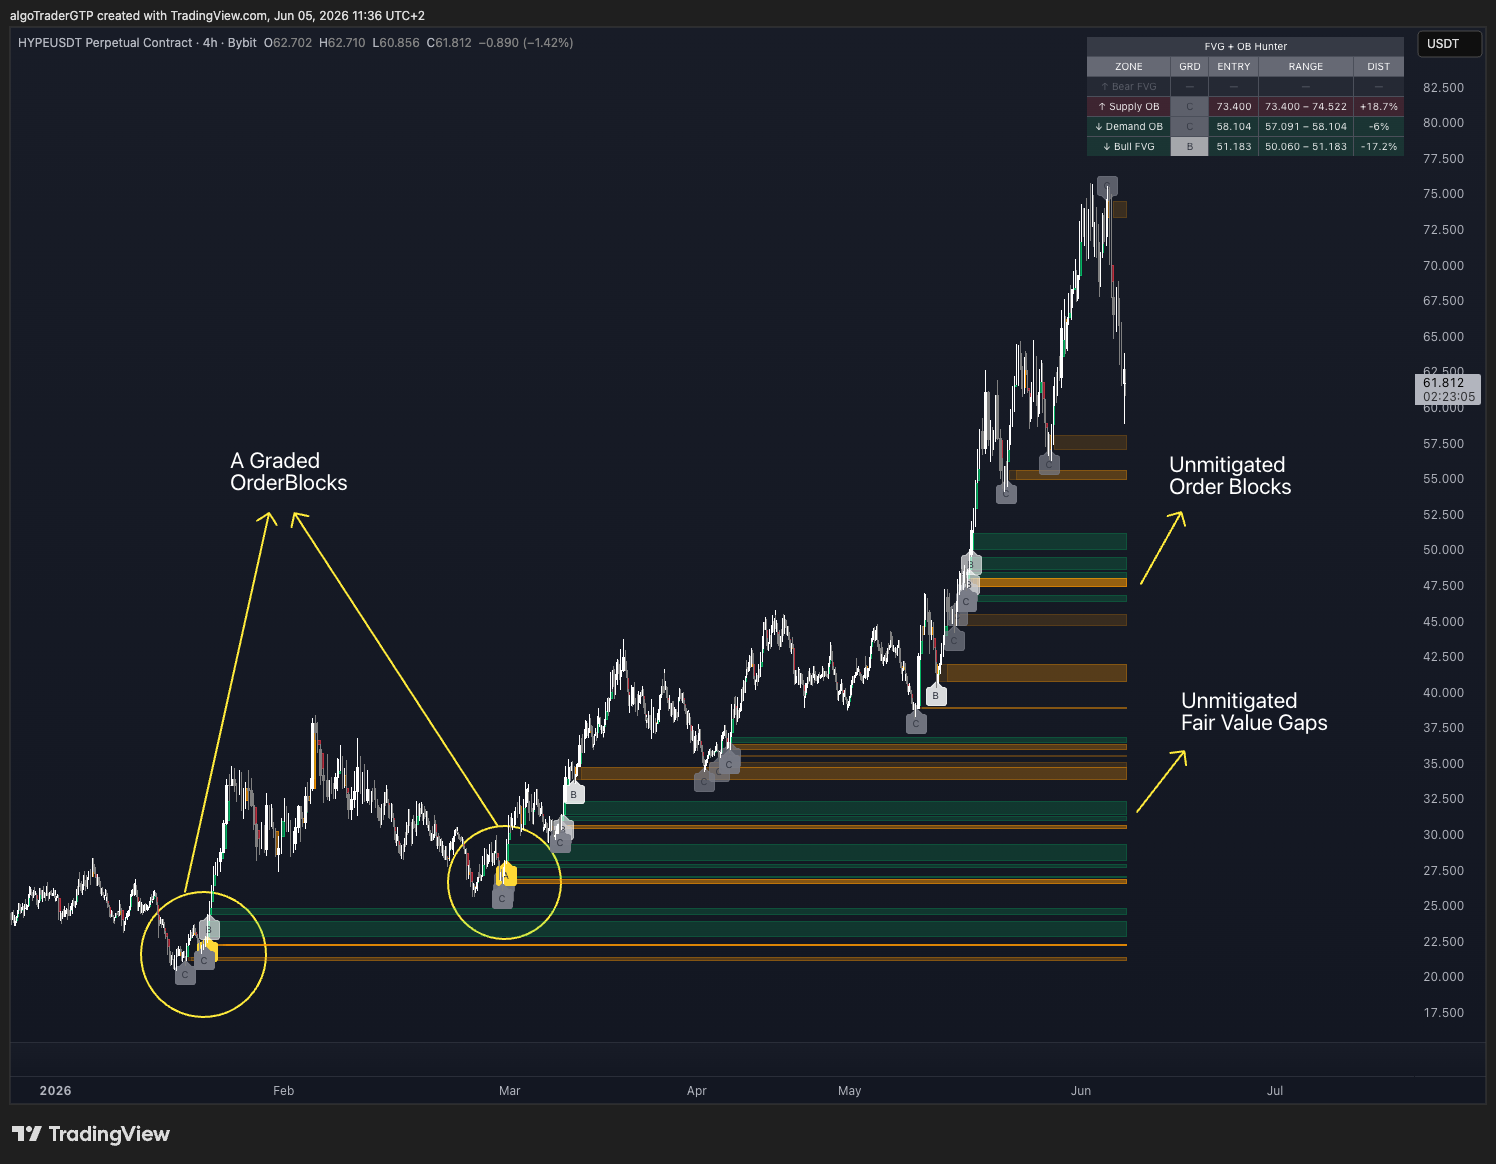
FVG + OB Hunter marks structure with exact triggers and invalidations on TradingView, so the setups you trade are the kind you can test honestly. And if you'd rather have the methodology run for you, our desk trades it live every session through the AlgoTraderPro signal service — see how the signals work.
Test like live is watching — then live stops surprising you. Disclosure: some links above are affiliate or product links — if you buy through them, AlgoTraderPro may earn a commission at no extra cost to you.