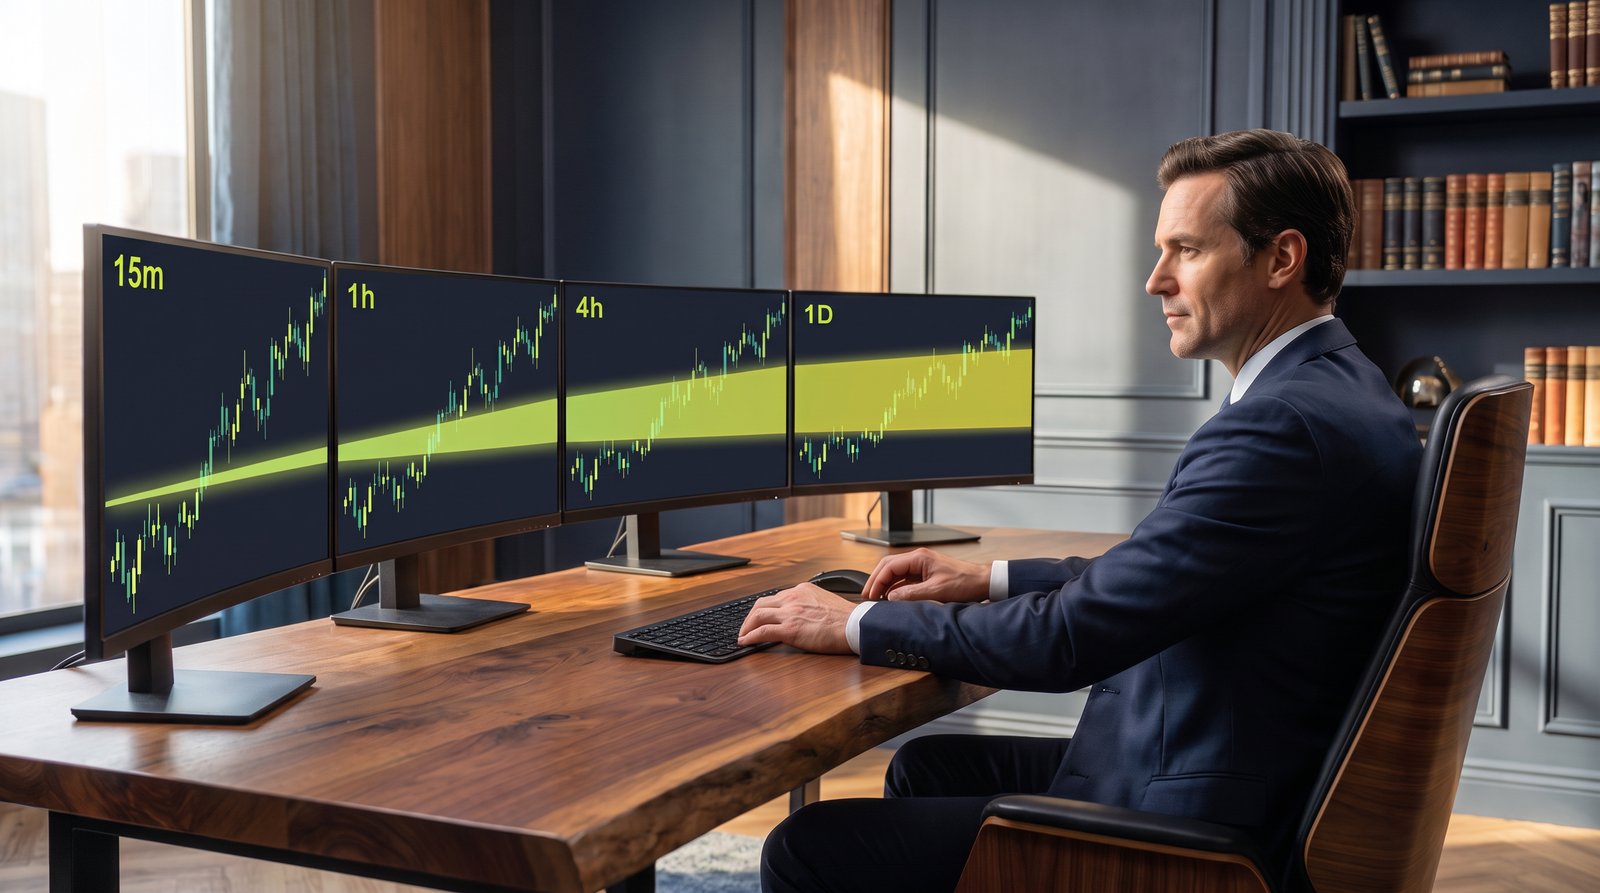
Fair value gaps held at the same rate on every timeframe we measured: price was rejected at a grade A gap about three times in four on the 15-minute, 1-hour, 4-hour and daily charts alike, across 15 crypto markets and two years. So the timeframe is not what makes a gap work.
What the timeframe does change is the size of the zone, and therefore the width of your stop and how much of your risk the fees take. That is the decision this article helps you make, in five steps, with our study as the evidence and ZoneHunter Live as the instrument. The full tables are free to download on the study data page.
The Same Gap Holds on Every Chart
A gap counts as rejected when price touches it and closes back out on the side it came from before any candle closes through it. Across 15 crypto markets and two years:
| Fair value gaps rejected | 15m | 1h | 4h | 1D |
|---|---|---|---|---|
| Grade A (≥ 1.0× ATR) | 75.6% | 76.7% | 74.0% | 79.4% |
| Grade C (< 0.5× ATR) | 57.5% | 58.7% | 58.9% | 57.7% |
Share of zones rejected · all 15 coins · full tables and standard errors on the study data page.
The grade is the zone's height measured against ATR(14): a grade A gap is at least as tall as one ATR, a grade C gap less than half. Grade decides how often a zone holds. The timeframe does not.
Timing behaves the same way once you count in candles instead of hours: price typically came back to a gap within two candles, and roughly six in ten grade A rejections happened on the very first candle that touched the zone — on all four timeframes.
What the Timeframe Really Changes: Zone Size and Fees
Zones grow with the timeframe, so your stop grows with it too. The fee is a fixed share of price, which means the same round trip costs a very different share of your risk depending on where you trade it:
| Median fee per trade, in R | 15m | 1h | 4h | 1D |
|---|---|---|---|---|
| Grade A zone | 0.14R | 0.06R | 0.03R | 0.01R |
| Grade C zone | 0.75R | 0.37R | 0.18R | 0.06R |
Fair value gaps, all 15 coins, 0.11% round trip, stop just beyond the zone. Every figure is measured before slippage.
Read the bottom-left cell: on a 15-minute grade C gap, three quarters of a unit of risk is gone in fees before the trade does anything. The same trade on the daily chart pays 0.06R. That is the real timeframe decision.
It also explains why the entry alone is not an edge. Buying the first touch of a grade A gap with the stop beyond it and a 3:1 target won 24.9% of the time on 15-minute charts, 26.2% on hourly, 23.6% on 4-hour and 29.2% on daily, on ten coins we never used to form an idea — a 23.6–29.2% range that straddles the 25% a 3:1 trade needs just to break even, before fees and slippage, on every timeframe. The trade you build around the zone is what decides the result.
Choose Your Timeframe in Five Steps
- Start from the trade you want to hold. A trade you intend to manage inside a session belongs on the 15-minute or 1-hour chart; one you are happy to leave for days belongs on the 4-hour or daily. The zones hold equally well, so let your schedule decide.
- On low timeframes, take only the large zones. A grade A gap is at least one ATR tall. Below that, on a 15-minute chart, the fee is a serious part of your risk before the trade even moves.
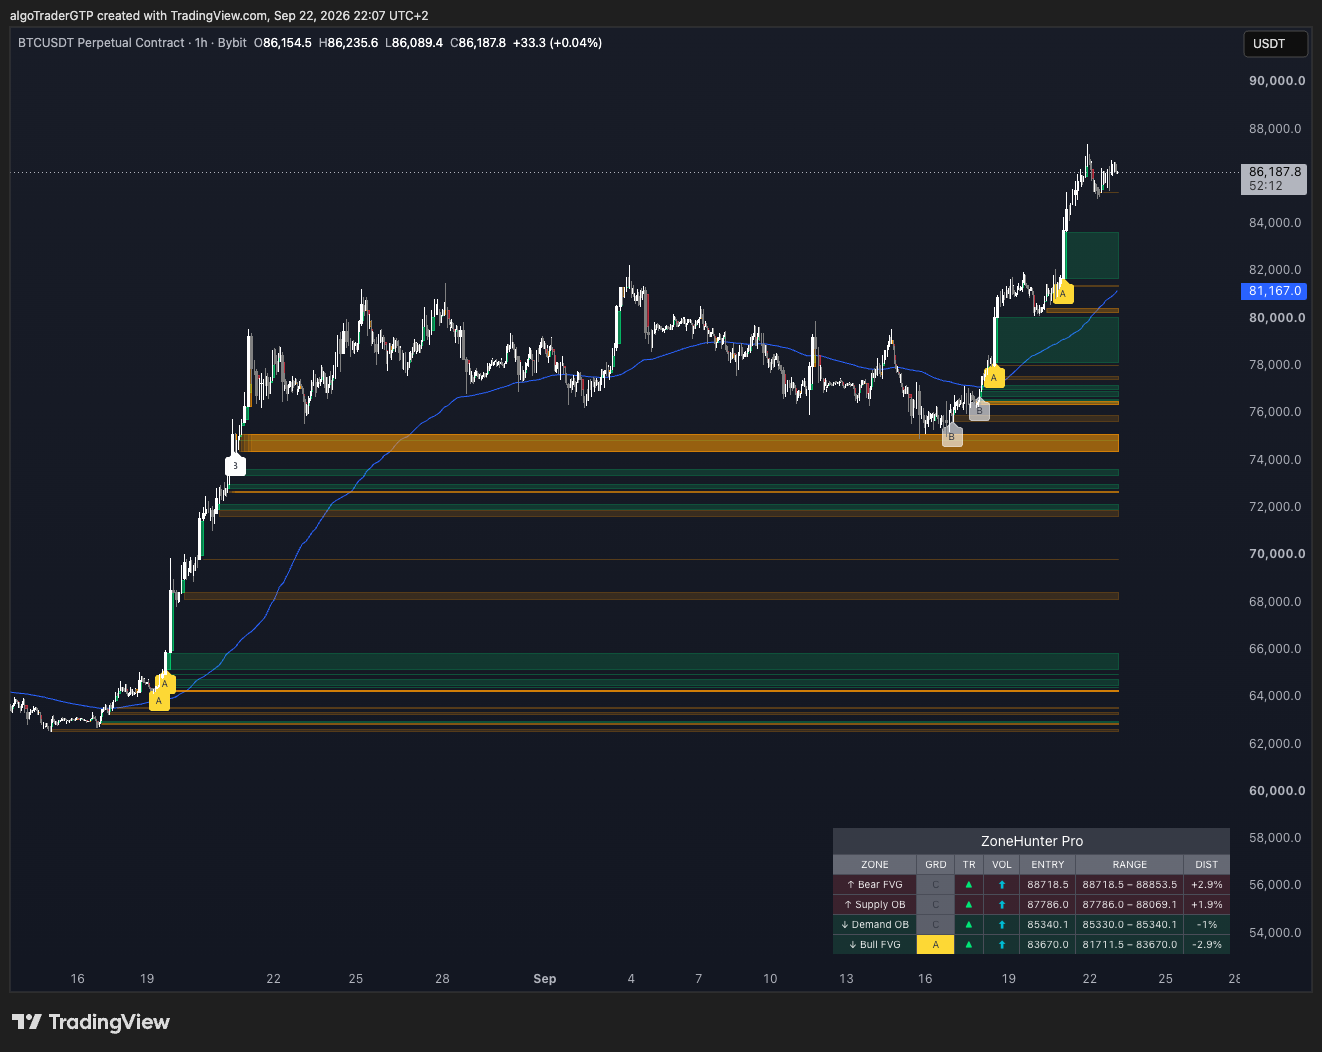
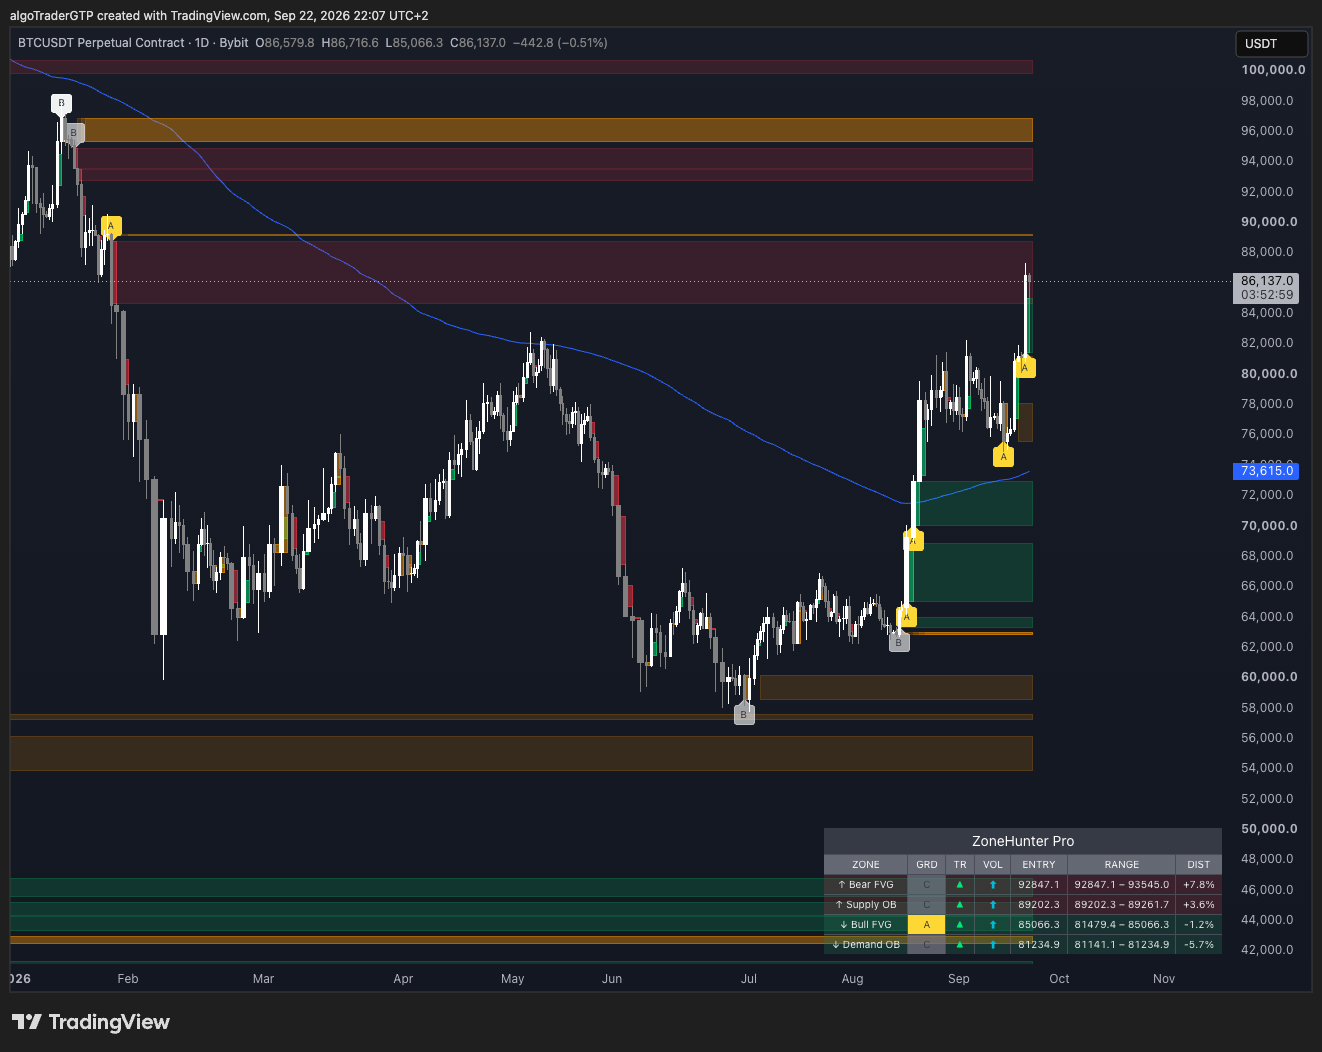
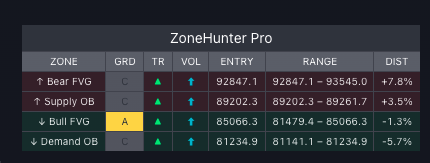
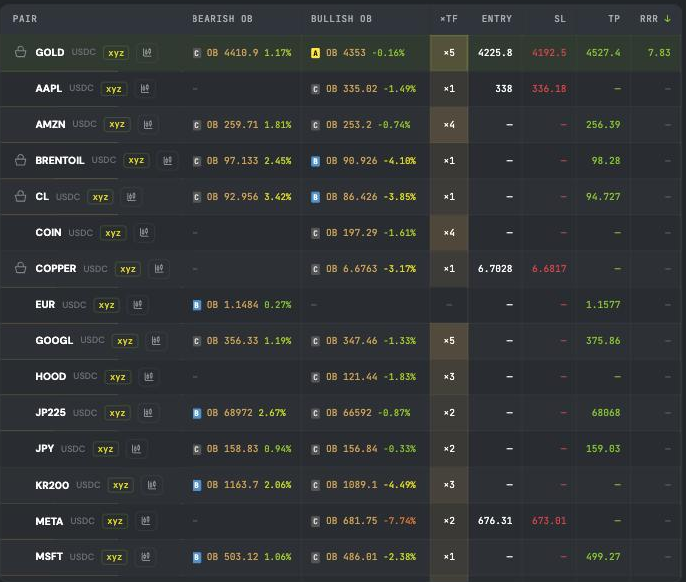
- Prefer zones that line up across timeframes. ZoneHunter Live's ×TF column counts how many timeframes have a zone at the same price. More timeframes pointing at one area means more traders watching the same level.
- Check the reward-to-risk after fees, and skip when it fails. The table gives you entry, stop, target and net reward-to-risk for the zone you picked. If the number does not justify the trade, no timeframe will fix it.
- Set an alert instead of watching. Price came back to a gap within about two candles on average, but that is hours on the 4-hour chart and days on the daily. Let the alert tell you.
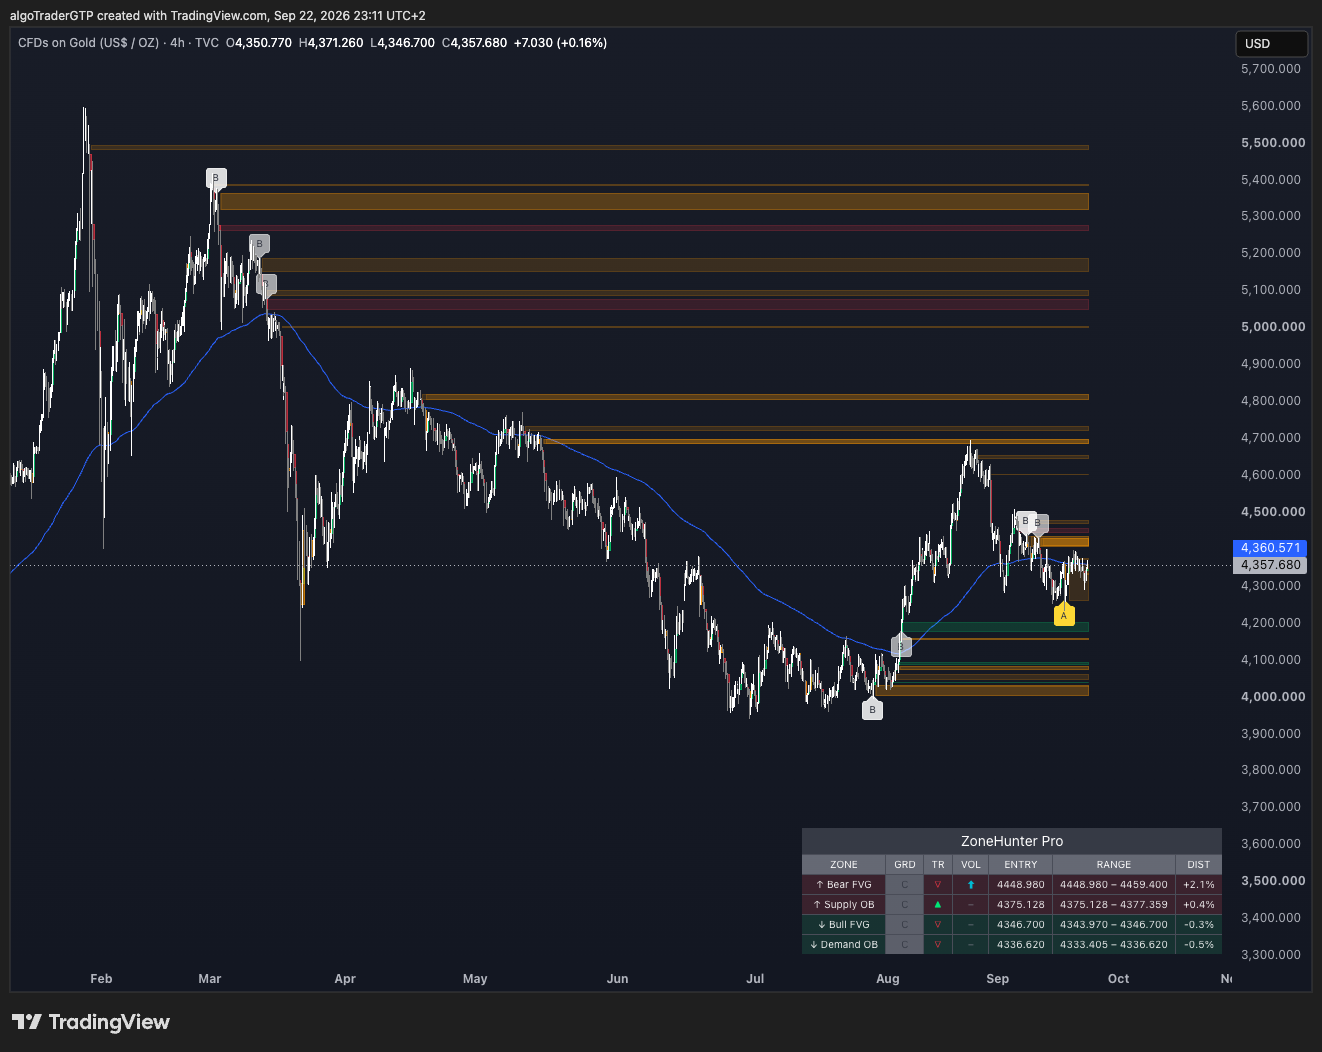
This is educational, not financial advice. Every figure comes from a study of past data on 15 crypto markets, measured before slippage. Zones describe structure, not certainty — always define your invalidation and size positions for risk.