
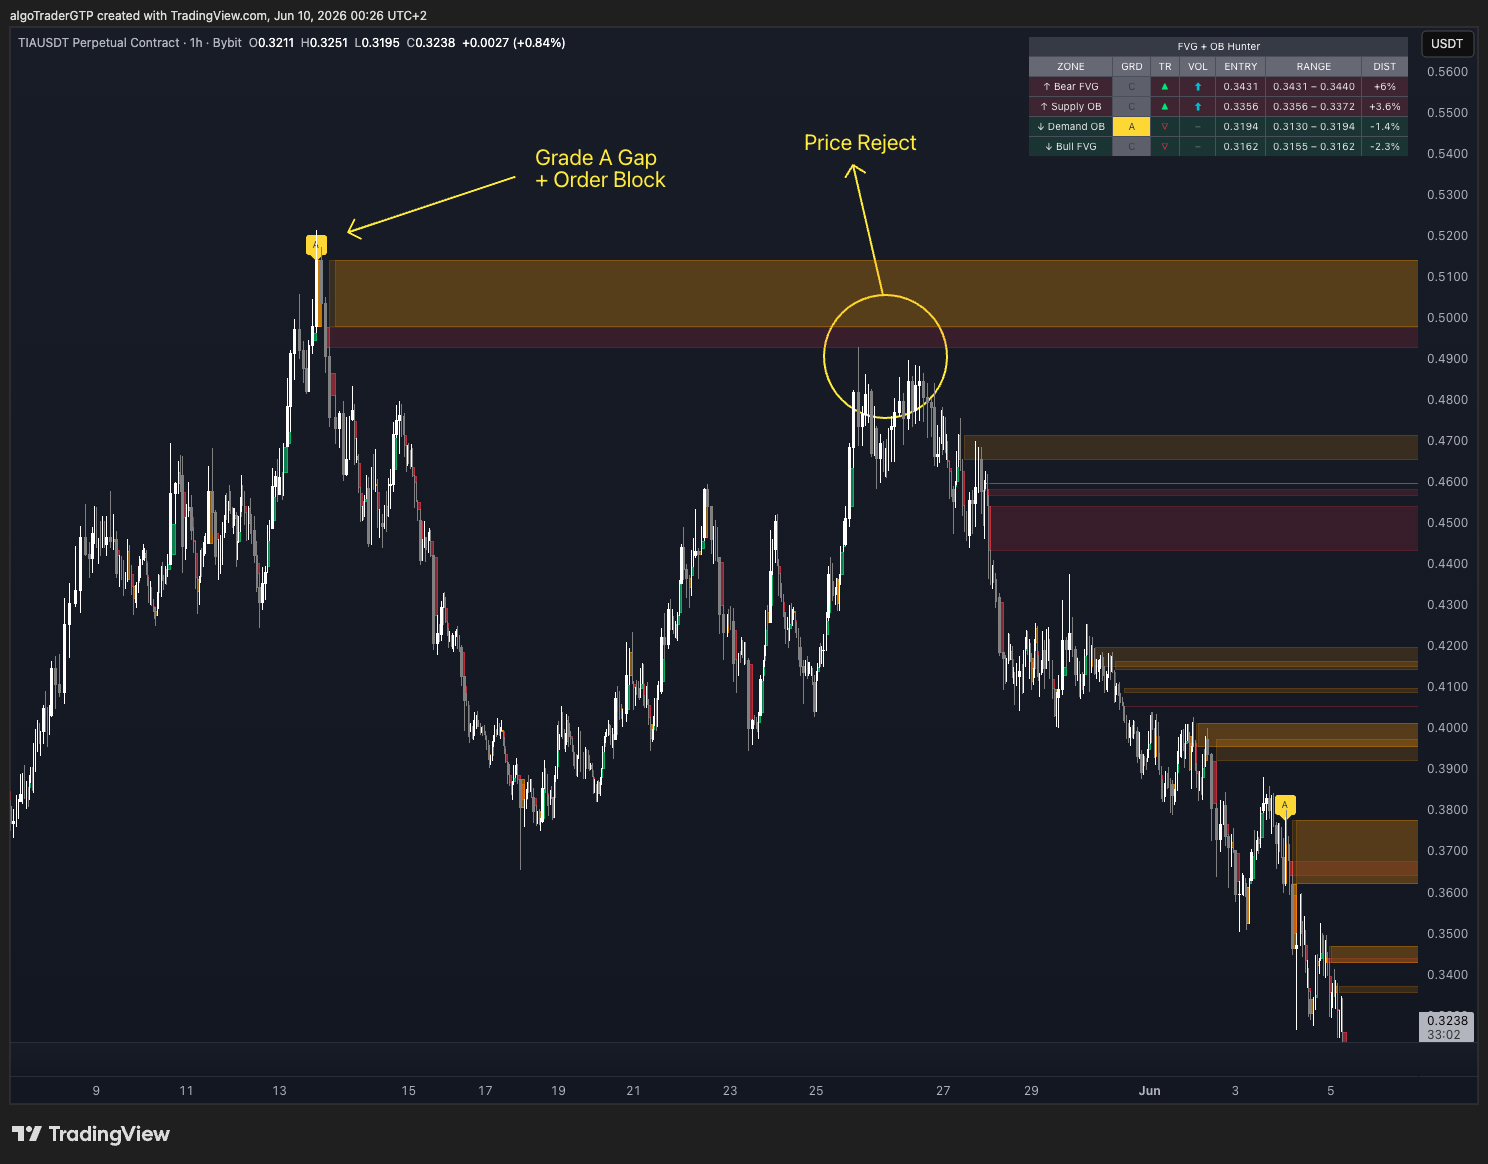
We tested fair value gaps and order blocks on 15 crypto markets over two years, and re-checked every result on ten coins we never used to form an idea. The zones are real: price usually reacts at them, and the strongest are rejected about three times in four, often on the very first candle. A reaction is where a trade begins. Buying the first touch reached a 3:1 target only about as often as breaking even requires, on every timeframe and filter we tested, which shows where the real work is. What decides the outcome is how the trade is built: the entry, the stop, the target and the costs. ZoneHunter Pro finds and grades the zones exactly as we measured them; TradePlanner Pro helps you build the trade around them.
Educational research, not financial advice. Every figure below is historical, measured before slippage, and describes how zones and simple trades behaved in the past. The full methodology is at the end of this page.
From Zone Survival to a Simulated Trade
In June we published a study of 5,468 fair value gaps. Its measurements hold up: re-run on the same settings, they reproduce to the decimal. What we improved is what those measurements were used for. The June expected-value figure credited every gap that did not fully fill with capturing the whole reward, with no stop, no target and no intrabar path. That describes whether a zone survived. It does not describe a trade.
This study simulates the trade itself: an entry, a stop, a target, the candle-by-candle path between them, and fees. Simulating the trade also changes the sample. On the 24 months to September 2026, June's settings find 917 grade A gaps; 558 of them became trades that reached either the stop or a 2:1 target within June’s 25-candle window, because a zone that never triggers or never resolves is not a trade. Those 558 trades reached the target 32.4% of the time (standard error 2.0 points), against the 33.3% a 2:1 trade needs to break even before costs.
The rest of this page is what we learned by measuring the trade, starting with the part the zones get right. Our zone behaviour page carries the full tables by grade and timeframe.
Strong Zones Draw a Reaction on Every Timeframe
A zone is rejected when price touches it and then closes back out on the side it came from, before any candle closes through it. Across all 15 coins and within 200 candles:
| Fair value gaps | 15m | 1h | 4h | 1D |
|---|---|---|---|---|
| Grade A (≥ 1.0× ATR) | 75.6% ± 0.4 | 76.7% ± 0.7 | 74.0% ± 1.4 | 79.4% ± 2.3 |
| Grade B (≥ 0.5× ATR) | 69.2% ± 0.2 | 70.6% ± 0.5 | 70.9% ± 1.0 | 74.0% ± 1.4 |
| Grade C (< 0.5× ATR) | 57.5% ± 0.1 | 58.7% ± 0.3 | 58.9% ± 0.5 | 57.7% ± 0.8 |
| Grade A zones measured (n) | 13,081 | 3,403 | 1,012 | 321 |
Share of zones rejected ± one standard error · all 15 Bybit USDT perpetuals · held-out and study coins shown separately on the zone behaviour page.
Two things belong next to that table. First, the grade ordering is partly geometry: a zone taller than one ATR needs a bigger candle to close through it. Second, a rejection is an immediate event. Price typically reached a fair value gap within two candles, and 62–66% of grade A rejections (82–86% for grade C) happened on the very first candle that touched the zone. A rejection tells you where attention belongs; the trade still has to be built.
A Reaction Is Where a Trade Begins
The simplest trade on a zone is to buy the first touch of its near edge, with the stop just beyond the far edge. On the ten held-out coins, that trade reached a 3:1 target at these rates, against the 25% a 3:1 trade needs to break even:
| First touch, 3:1 target | 15m | 1h | 4h | 1D |
|---|---|---|---|---|
| Grade A fair value gap | 24.9% ± 0.5 | 26.2% ± 1.0 | 23.6% ± 1.7 | 29.2% ± 3.2 |
| Grade A order block | 24.7% ± 0.4 | 25.4% ± 0.9 | 21.9% ± 1.7 | 20.0% ± 3.1 |
| Trades (FVG / OB) | 8,016 / 10,996 | 2,032 / 2,306 | 632 / 608 | 202 / 165 |
Win rate ± one standard error · held-out coins only · breakeven at 3:1 is 25% before costs.
Every cell sits close to breakeven, and none is clearly above it. Before costs, buying the touch is roughly a coin flip at 3:1; fees and slippage only subtract from there. Waiting for a rejection candle before entering did not change the hit rate on any of the four timeframes either. That is useful to know, because it moves the attention to the part of the trade you control.
Zone Grade Tells You Your Stop Width and Your Fee Load
At a fixed 3:1 target, grade C zones win more often than grade A zones, in every sample in the table. The reason is stop width. A grade A stop is about five times wider, so the same 3:1 target asks for a much bigger move.
| 1h, first touch, 3:1 | Grade A win rate | Grade C win rate | Average stop A / C |
|---|---|---|---|
| Fair value gaps, study coins | 26.1% ± 1.3 | 28.7% ± 0.4 | 1.63% / 0.28% |
| Fair value gaps, held-out coins | 26.2% ± 1.0 | 29.2% ± 0.3 | 2.32% / 0.41% |
| Order blocks, study coins | 22.9% ± 1.3 | 32.5% ± 0.5 | 1.53% / 0.30% |
| Order blocks, held-out coins | 25.4% ± 0.9 | 32.5% ± 0.3 | 2.18% / 0.44% |
Grade C trades resolved: 11,385 / 22,938 (FVG) and 9,587 / 19,011 (OB); grade A: 1,102 / 2,032 and 1,118 / 2,306.
The narrow stop is also where fees bite. The same 0.11% round trip is a very different share of the risk depending on zone size, and zone size grows with timeframe:
| Median fee per trade, in R | 15m | 1h | 4h | 1D |
|---|---|---|---|---|
| Grade A zone | 0.14R | 0.06R | 0.03R | 0.01R |
| Grade B zone | 0.27R | 0.12R | 0.06R | 0.02R |
| Grade C zone | 0.75R | 0.37R | 0.18R | 0.06R |
| Grade C trades paying more than 0.25R | 95% | 72% | 31% | 1% |
Fair value gaps, all 15 coins, 0.11% round trip, stop just beyond the zone.
On the five majors alone, the median grade C trade on 15-minute charts paid 1.02R in fees: on half of those trades the fee was larger than the risk.
Five Rules for Building the Trade
Price your fees in R before you enter. Fee in R = round-trip fee % ÷ stop distance %. Your breakeven win rate at a target of R is (1 + fee in R) ÷ (R + 1). A 0.11% round trip on a 0.30% stop costs 0.37R, so a 3:1 trade needs about 34% winners instead of 25%. On a typical grade A 1h zone the fee is 0.06R and the bar is about 26.6%.
Set ladder targets for the average rung. If you scale out in n equal parts evenly spaced up to a target, you collect (n + 1) ÷ 2n of that target on a full run: 75% with two parts, 62.5% with four, 60% with five. With four parts, an average of 2R needs the last one at 3.2R.
Compare entries and grades at the same target price. An entry ladder puts your average entry closer to the stop, so its 3R target sits at a nearer price than a single entry's 3R. When we priced both at the same level, they won exactly as often. The same logic explains grade C's higher hit rate: a nearer target, not a better zone.
Plan every entry ladder for a full fill. The stop sits beyond every rung, so price cannot reach it without filling the whole ladder. Losing trades fill completely; winning trades often fill only part. Size the full ladder as your risk.
Choose scaling out for consistency. Scaling out with a breakeven stop lifted the share of green trades from about 45% to 71–76% (n 1,621 and 1,718 grade A trades); expectancy did not improve. It is a way to smooth the ride, and worth choosing with that in mind.
Thirteen Ideas We Measured on the Way
Before settling on these conclusions we tested the refinements traders most often reach for. Each one is recorded here so you can skip the experiment:
| Idea | What we measured |
|---|---|
| Draw the zones differently | Detection matches ZoneHunter Pro’s Pine source on 11 of 11 components |
| Move the stop (zone edge vs swing, pivot 2 or 3) | Win rate moved about one point across 18 configurations, inside the error bar |
| Count the target first when one candle hits both | About two points; 21 of 921 stopped trades affected |
| Count near-misses that never triggered | 6–8% of zones |
| Remove duplicate order blocks | 0.7 points |
| Expire zones after 6 to 96 candles | 25.5–26.3% at 3:1 for grade A gaps, with no trend |
| Rest the limit ahead of the zone | Lower win rate in 30 of 30 cells: 31% more risk for 3% more trades |
| Skip zones after the move already ran | Every difference under 1.2 standard errors, pointing opposite ways on FVGs and order blocks |
| Favour stacked gaps above the zone | +13.3 points on the five study coins (66 trades), −6.6 on the ten held-out coins (115 trades) |
| Pick a better timeframe for zones | 0 of 24 comparisons replicate once time is counted in candles |
| Favour gaps with an order block right behind them | Within ±2 points of gaps without one (0 of 8 comparisons) |
| Wait for a rejection candle before entering | No higher hit rate on any of 4 timeframes (0 of 8) |
| Run the same plan on 4h instead of 1h | No improvement that replicates (0 of 8) |
The stacked-gap result is the one worth remembering. On the five study coins it held in both halves of the two years, which looks like strong evidence. On ten coins it had never seen, it reversed. Splitting the same coins by date is not an out-of-sample test; holding out whole markets is.
Two Tools, One for Each Half
Finding the zone is the easy half, and it is the half ZoneHunter Pro does. It detects every fair value gap and order block as it forms and grades each one exactly as this study measured them, down to the same Pine logic. A zone indicator publishing data like this may look surprising; it is what makes the indicator worth trusting, because you can see precisely what it finds.
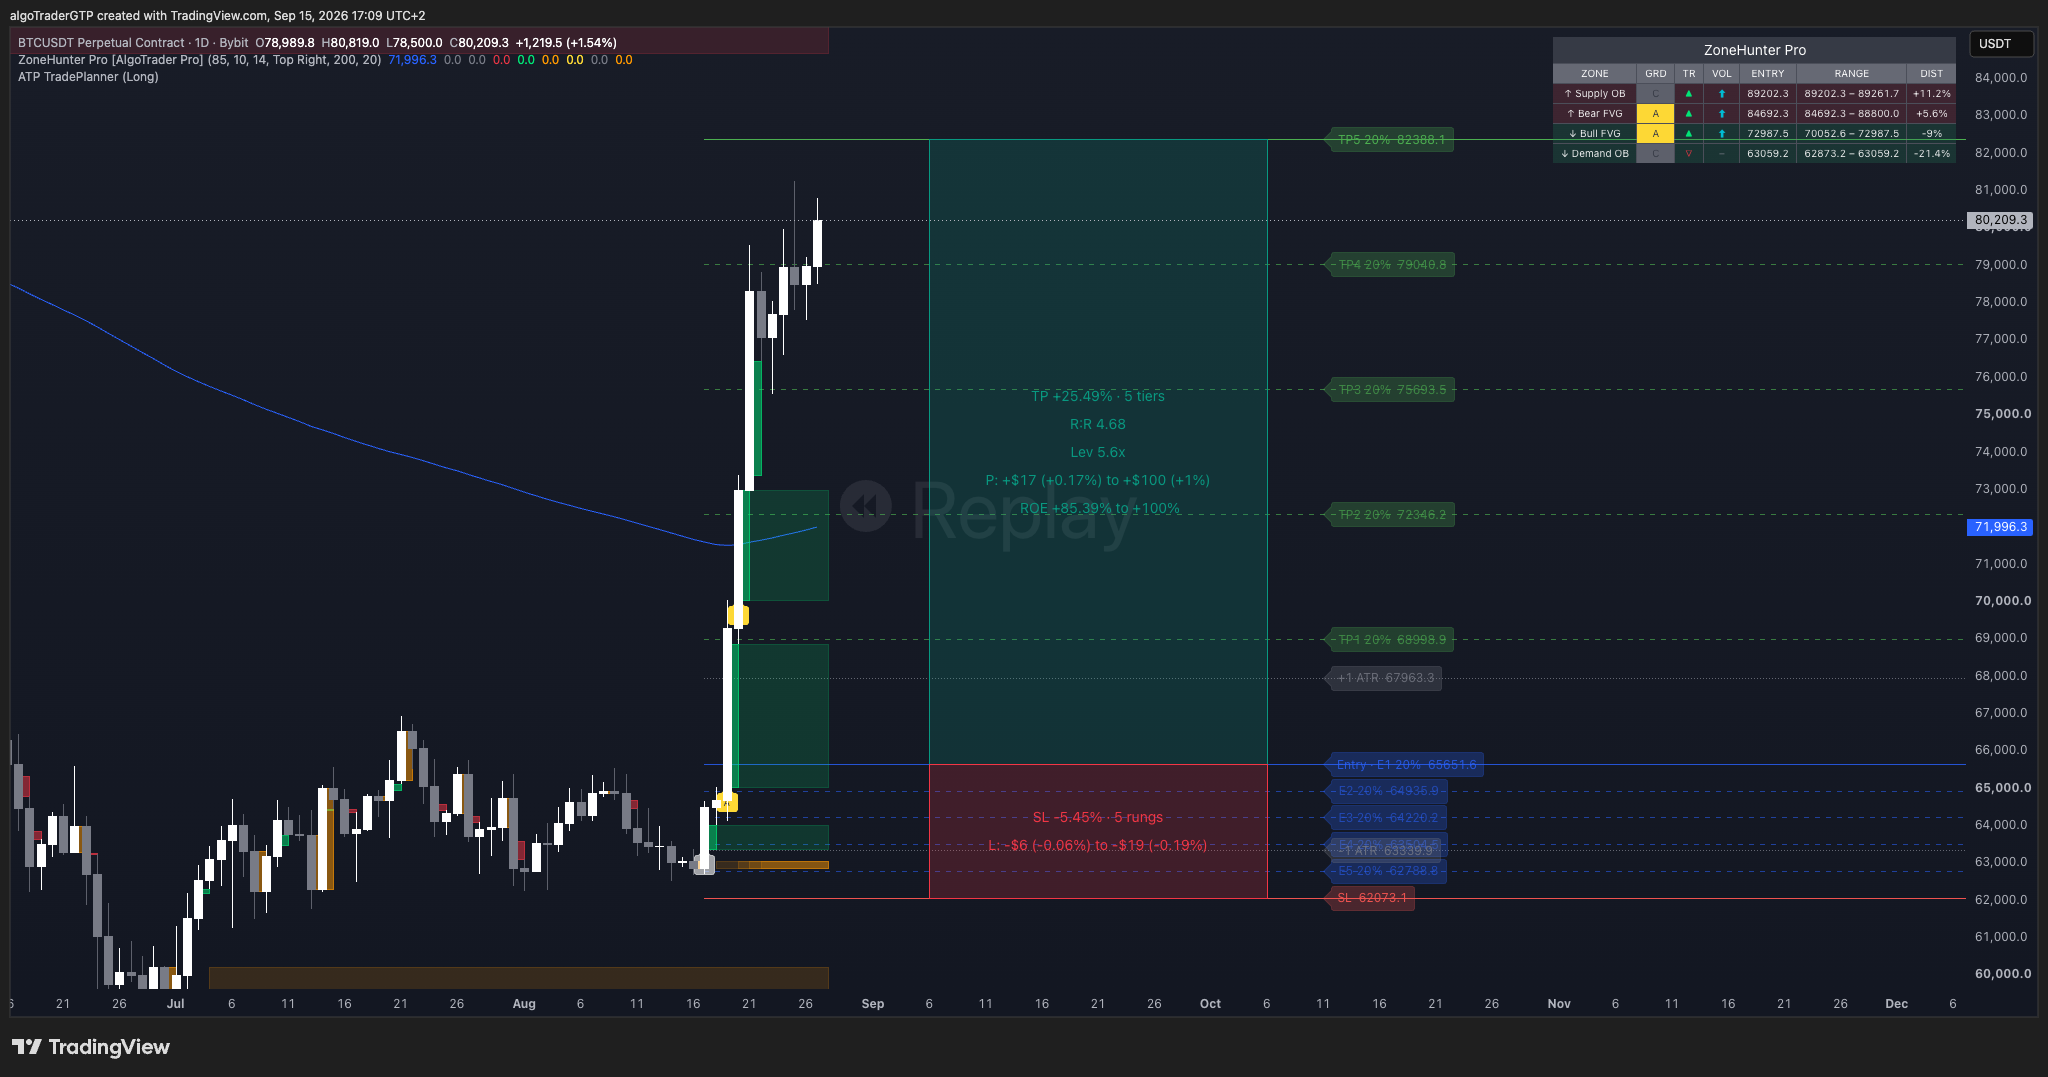
The other half is the trade. TradePlanner Pro lays the plan out on the same chart: an entry ladder, take-profit tiers, the stop, reward-to-risk and leverage, with profit and loss worked out for each level.
Both run on TradingView. To see graded zones with an entry, stop and fee-adjusted reward-to-risk for free, open ZoneHunter Live.
How We Measured It
- Markets. 15 Bybit USDT perpetual futures. Every idea was formed on BTC, ETH, SOL, BNB and XRP. ADA, AVAX, LINK, DOGE, DOT, LTC, ATOM, NEAR, APT and ARB were held out and used only to confirm.
- Timeframes and window. 15-minute, 1-hour and 4-hour candles from 20 September 2024 to 12 September 2026; daily candles over each coin’s full Bybit history to 11 September 2026. Trade tests use 1-hour candles unless a table says otherwise. The candles are frozen, checksummed snapshots and are never re-downloaded.
- Fair value gap. A three-candle pattern, detected exactly as ZoneHunter Pro’s Pine script does (11 of 11 components verified). Bearish: candle 1’s low is above candle 3’s high, candle 1’s low is at or below candle 2’s open, and candle 3’s high is at or above candle 2’s close. The zone is the gap between candles 1 and 3. Bullish mirrors it.
- Order block. The body of the last opposite-coloured candle within the 10 candles before a fair value gap completes: the last bullish candle before a bearish gap, the last bearish candle before a bullish one.
- Grade. Zone height ÷ ATR(14) on the detection candle: A ≥ 1.0, B ≥ 0.5, C < 0.5.
- Zone outcomes, within 200 candles, first event wins: touched (a wick reaches the zone); rejected (touched, then a close back out on the near side before any close through; ZoneHunter Pro calls this “mitigated”); invalidated (a close through the far edge first); still open (touched, neither yet); never reached. Zones whose window runs past the end of the data are excluded. ZoneHunter Pro tracks order blocks as active or broken; here the same outcomes are applied to the order block’s body.
- Trade test. Entry at the first touch of the zone’s near edge; stop at the far edge plus 0.1× ATR; target a multiple of that risk. When one candle contains both the stop and the target, the stop is counted first. Trades have 200 candles to reach either; trades still open after that are left out.
- Costs. A 0.11% round trip (Bybit taker, 0.055% per side). Not modelled: slippage, funding, queue position and partial fills. Every result is measured before slippage.
- Statistics. Standard error of a rate = √(p(1 − p) ÷ n). A difference counts as a finding only if it has the same sign on the study coins and the held-out coins, the same sign on fair value gaps and order blocks, is at least 3 points and 2 standard errors on the held-out coins, and holds on at least 7 of the 10 held-out coins. The timeframe comparisons were written down before any result was computed. Zones overlap in time and the coins move together, so treat each standard error as a lower bound on the real uncertainty.
- The June 2026 study measured 5,468 fair value gaps on BTC, ETH, SOL, BNB and XRP 1-hour candles with a 200-EMA trend filter, a volume filter and a 25-candle window, and tracked zone survival only.
- Data. The zone-behaviour, timing, fee and first-touch tables are free to download and reuse under CC BY 4.0 on our research data page.
This is educational, not financial advice. Backtested statistics describe historical behaviour, are measured before slippage, and do not predict future results. Nothing here is a recommendation to buy or sell any asset. Crypto derivatives carry a high risk of loss.
Disclosure: some links above are affiliate or product links — if you buy through them, AlgoTraderPro may earn a commission at no extra cost to you.