
Here is the routine: open ProvenAlpha, read the community bias, find the pair you plan to trade and read its consensus, open the posts behind it, mark the levels the crowd keeps naming, then hold your own plan against all of it — the crowd agrees, disagrees, or is crowded into the same trade. It takes about five minutes, and it works for gold and FX as well as crypto.
ProvenAlpha does the reading for you. Once a day it reads the posts of a curated panel of public Telegram channels and X accounts, pair by pair, and turns them into one table — the panel and the day's read are on the page, every post credited and linked. It shows what the crowd is saying, how loudly and where its levels are. It does not show anyone's entries, stops or targets, and it does not rank the analysts. The decision stays yours.
What ProvenAlpha Reads, and Why One Table Beats Twenty Channels
Most traders who follow analysts on Telegram end up in the same place: a dozen or more channels, a phone full of unread calls, and on any given pair one channel calling long while another calls short. Reading them all takes an hour. Reading only one or two means trading someone else's idea without knowing whether the rest of the room agrees.
ProvenAlpha turns that hour into one page:
- Community bias — the lean of the whole board for the day (bullish, bearish, mixed or neutral), how one-sided it is, and a short read of the main theme and the main risk.
- One row per pair — the direction the posts argue, their confidence (100 = all agree, 50 = an even split), their sentiment (−1 to +1), mentions split into Telegram and X, how many distinct channels they came from, and the support and resistance levels they keep naming.
- The evidence — each pair opens a page with those levels drawn on a chart, what the analysts said about each one, and the source posts, credited and linked.
It covers the markets analysts actually talk about. Most rows are crypto perpetuals on Bybit; the HIP-3 chip adds gold, FX and US stocks — perpetual contracts on Hyperliquid that track those references. A market nobody posted about has no row that day, which is information too.
The Five-Minute Routine, Step by Step
Step 1 — Read the Community Bias
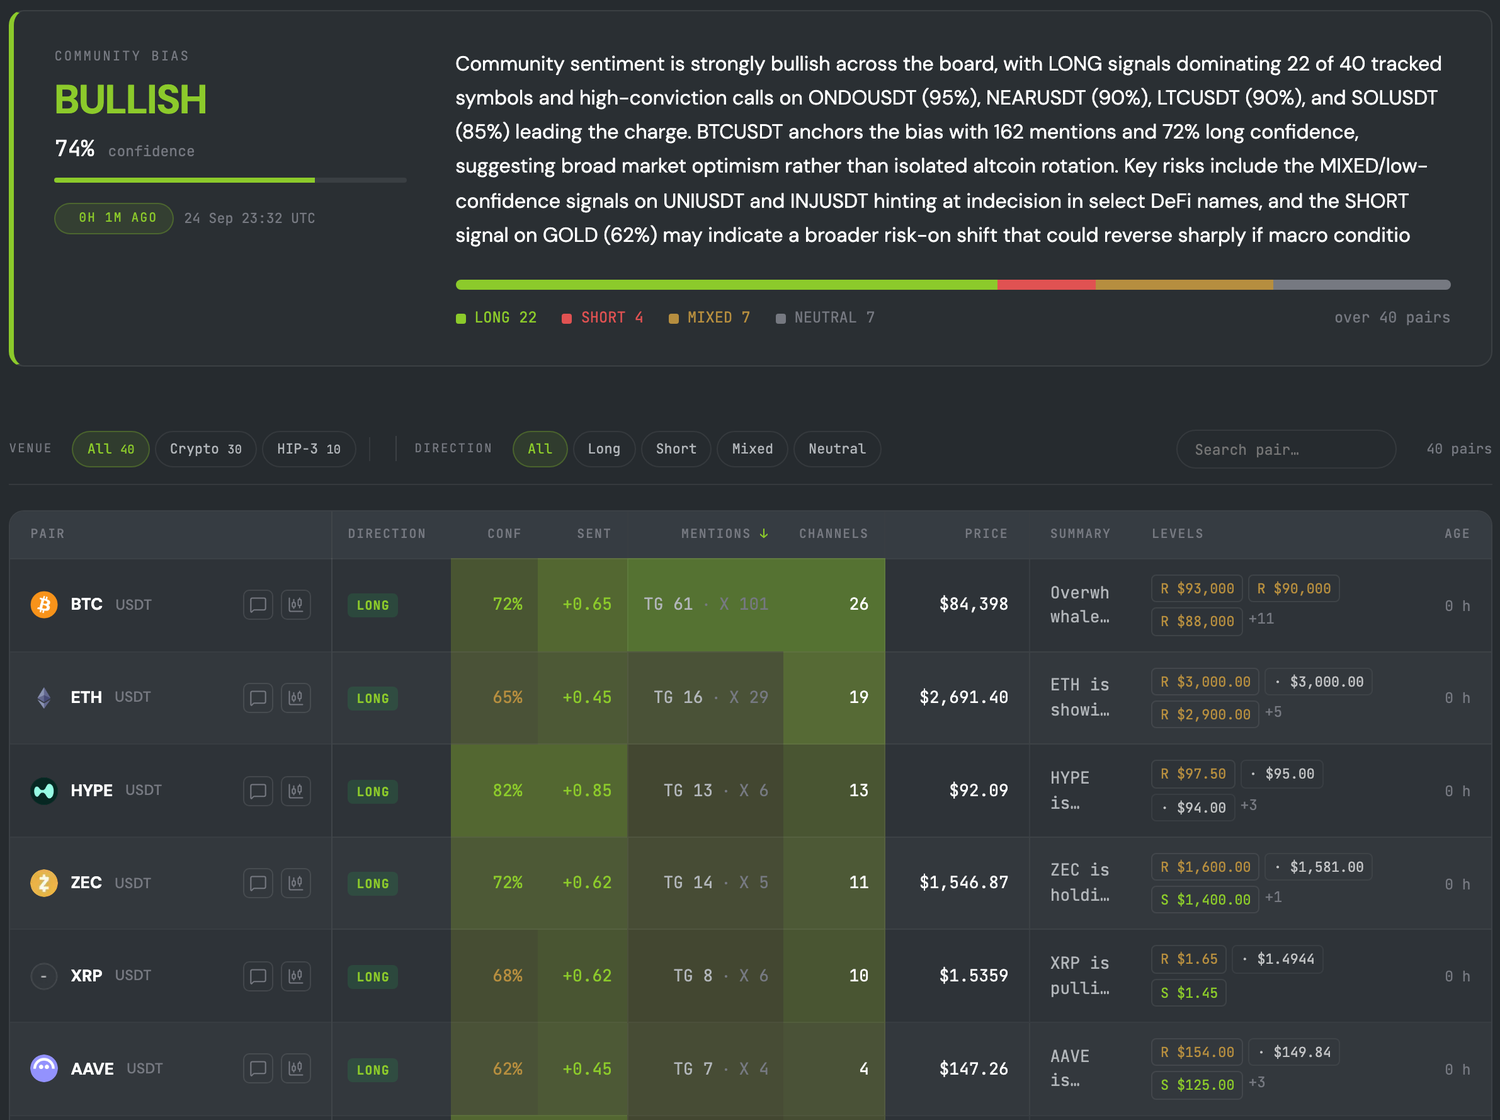
Start with the card at the top: the bias, its confidence and the count of pairs called long, short, mixed and neutral. This is the mood of the room before you look at any single market.
Look for: how one-sided the board is, and what the short read names as the main risk. Check the time on the card too: the read runs once a day in the European morning, and the status pill turns to Delayed when it is older than it should be. Skip: treating a bullish board as a reason to buy. It describes the crowd, not the market.
Step 2 — Find Your Pair and Read Its Consensus
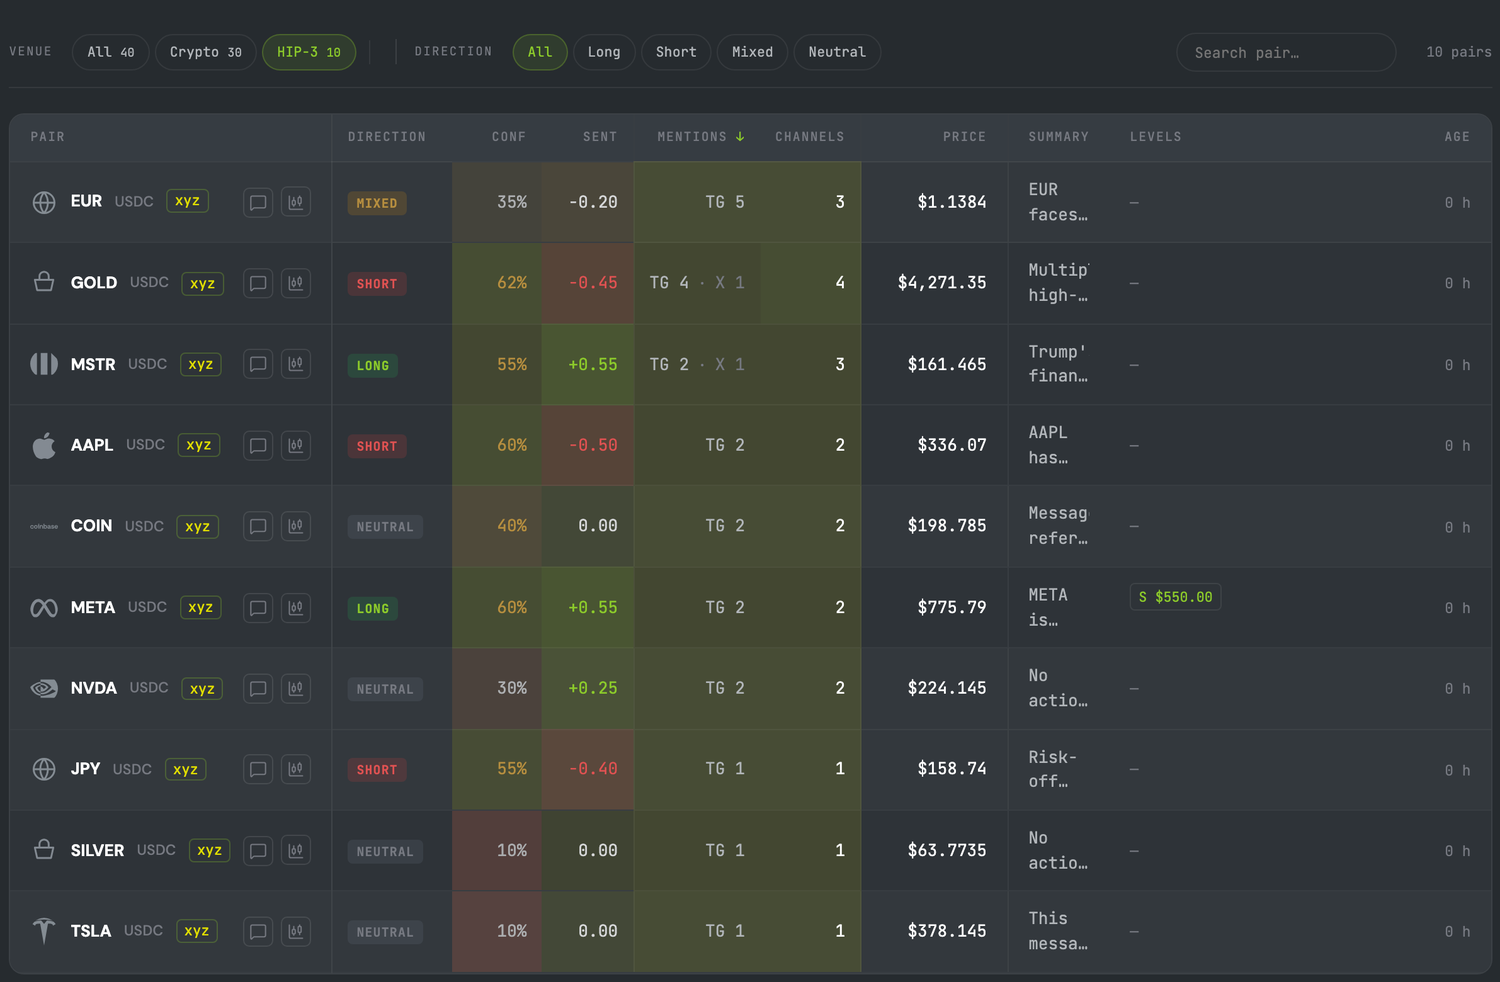
Search for the pair you plan to trade, or pick HIP-3 to see gold, FX and stocks. Read the row left to right: direction, confidence, sentiment, mentions, channels.
Look for: agreement that comes from many places. High confidence with mentions spread across many channels is a theme; the same count from one or two channels is one loud voice. A confidence near 50 means the crowd is split, whatever the direction label says. Skip: rows with one or two mentions from a single channel — too thin to tell you what the room thinks.
Step 3 — Open the Pair and Read the Evidence
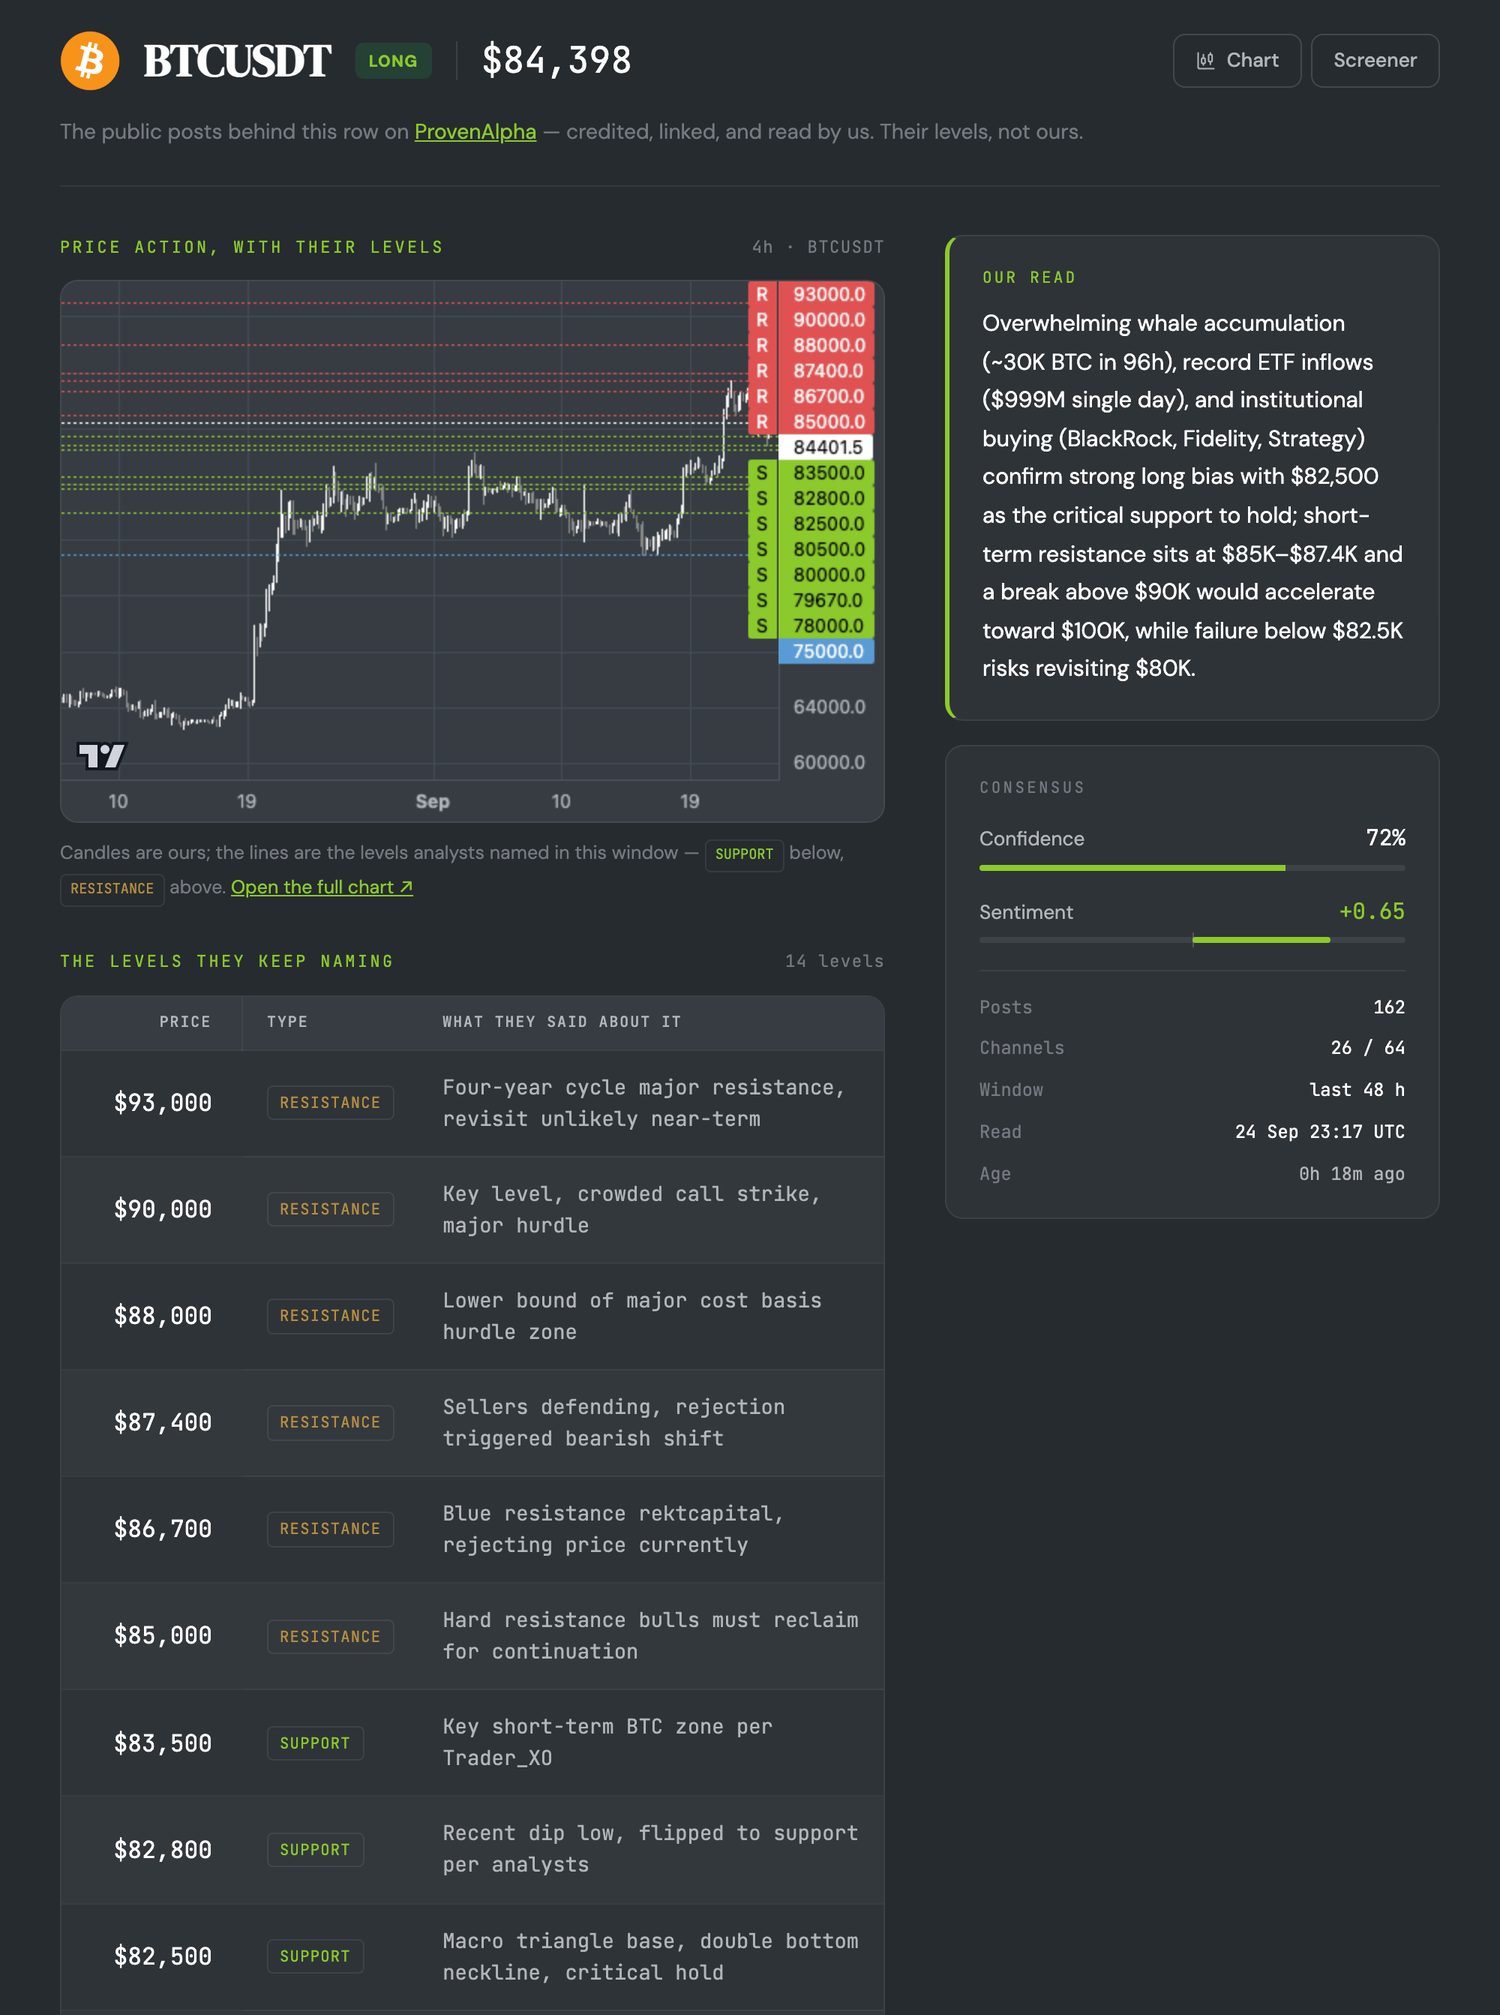
Click the pair. Its page shows the price chart with the analysts' levels drawn on it, a table of those levels with what was said about each, the source posts grouped by account, and the consensus card with the number of posts, the channels behind them and the time of the read.
Look for: reasons, not just directions — a level with an argument attached (a retest, a moving average, a pattern) tells you why traders will act there. Skip: posts that are advertising rather than analysis. The evidence is shown as it was posted, so you will see some, and reading them is how you weigh a row.
Step 4 — Mark the Crowd's Levels as Where Orders and Stops Sit
The levels are not ours, and they are not predictions. They are where the analysts' followers are likely to have orders waiting: buys at a named support, sells at a named resistance, and stops just beyond both. That is why price so often reacts at a popular level — and why it sometimes runs straight through one first, into the stops, before it turns.
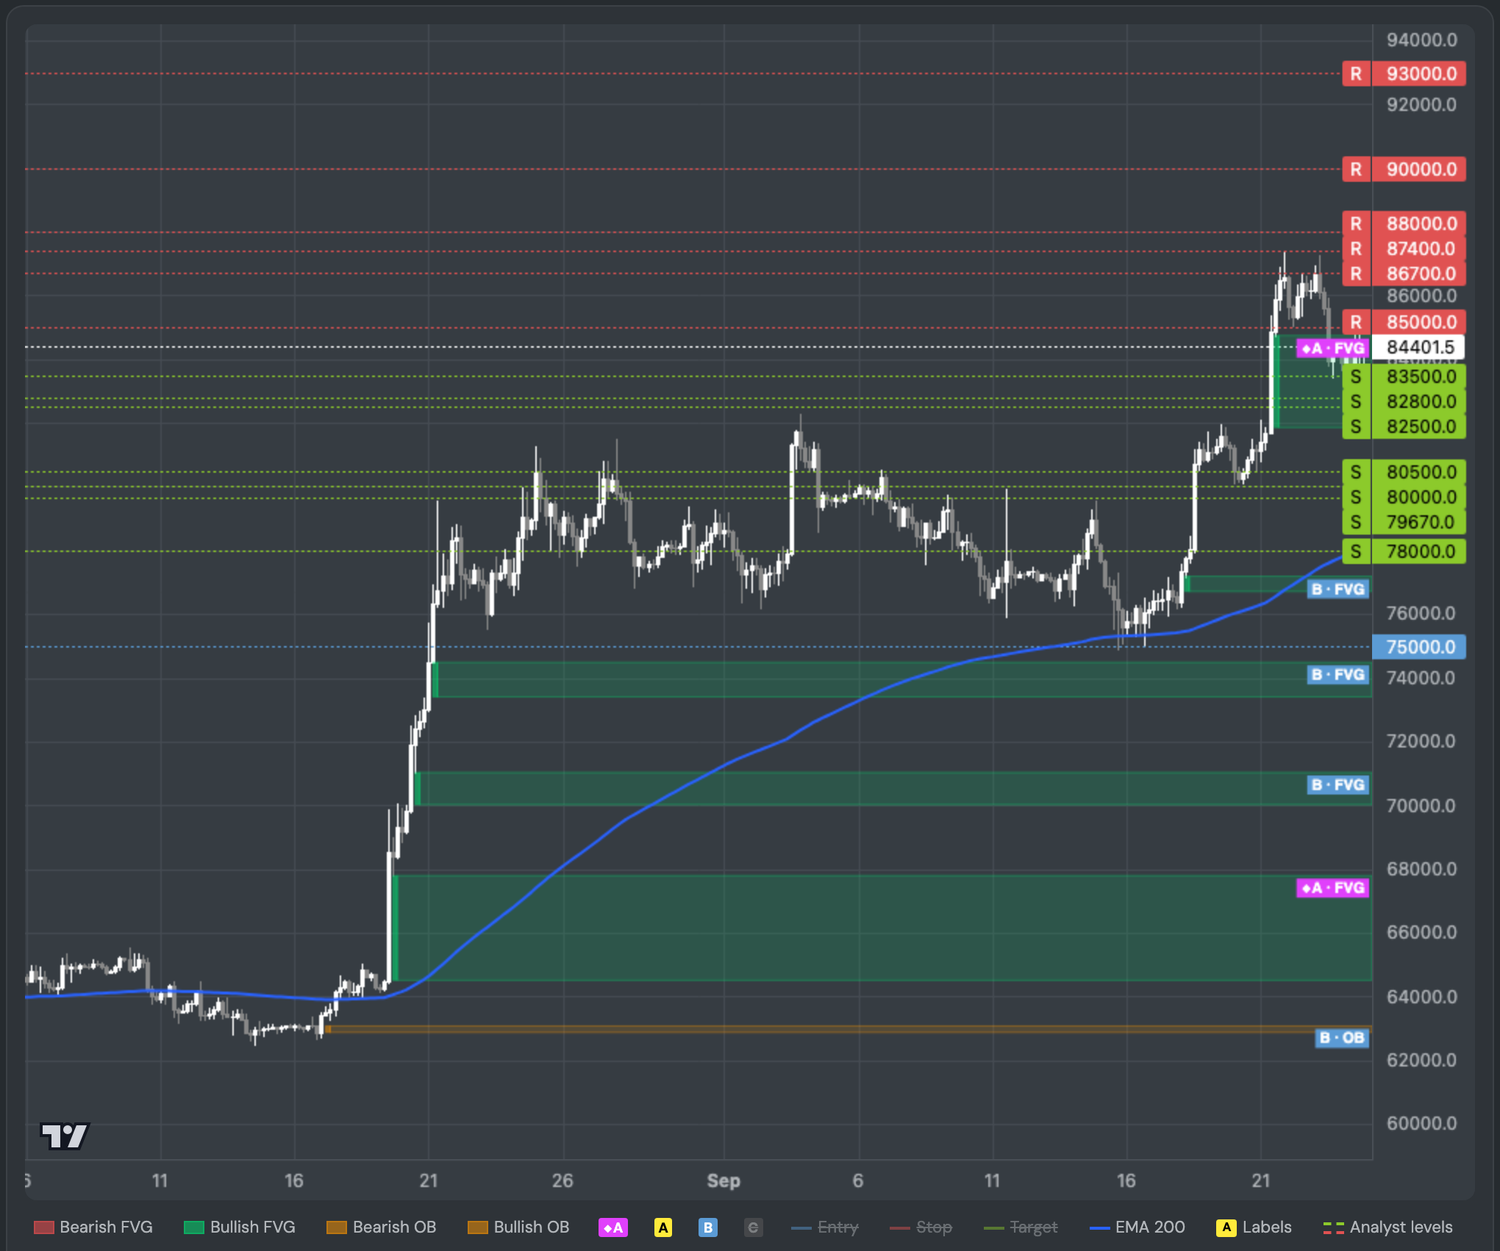
Put them next to structure. Click the chart icon to open the pair on ZoneHunter Live, where the Analyst levels layer draws the same lines over the graded order blocks and fair value gaps. Look for: a crowd level that sits on or next to a graded zone — two reasons for traders to act at the same price. Note when price has already traded through a named level: the orders planned there have met the market. Skip: levels far from price and far from any zone; they will not matter for today's trade.
Step 5 — Hold Your Own Plan Against the Crowd
Now bring your own trade — from the ten-minute screener routine, a zone on your chart, or your own analysis — and give it one of three verdicts:
- The crowd agrees. A mild confirmation. It is not a reason to trade bigger; your stop and target still decide the result.
- The crowd disagrees. Re-read your invalidation and make sure you know what the other side is seeing. Disagreement is not a reason to abandon a plan that is sound on structure.
- Crowded — be careful. High confidence, many channels and your entry or stop sitting right on a level everyone names. That is where the stops cluster. Place your stop beyond the crowd's level rather than on it, or wait for price to come through the level and settle.
Whatever the verdict, you do not have to watch the level all day. When your plan depends on price reaching a zone, let an alert do the waiting.
A Worked Example: 24 September 2026
An example of the routine, not a call. This is ProvenAlpha's read of 23:32 UTC on 24 September 2026, with ZoneHunter Live's 4-hour zones captured at 23:36 UTC. The numbers have moved since.
Step 1. The board read BULLISH at 74% confidence: 22 pairs long, 4 short, 7 mixed and 7 neutral, out of 40.
Bitcoin — the crowd agrees, and it is crowded. Long at 72% confidence, sentiment +0.65, 162 posts (61 on Telegram, 101 on X) from 26 of the 64 channels: the loudest row on the board, and a theme rather than one voice. Its page listed 14 levels. On ZoneHunter Live, the crowd's supports at 83,500, 82,800 and 82,500 all sat inside the grade A bullish fair value gap price had entered, from 81,855.0 to 84,736.7, and the first resistance they named, 85,000, sat just above the top of that gap.
For a long from that gap, the crowd agrees — and three named supports inside one zone is where their stops gather, so the stop belongs beyond the bottom of the gap, not just under 82,500. With Bitcoin at 84,398.5, that stop was 3.01% away while the crowd's first resistance was only 0.71% above: the reward to the crowd's first line was under a quarter of the risk. Verdict: a good zone to wait in, not a trade at that price. Set an alert near the crowd's supports and let price come down to them.
Gold (HIP-3) — too thin to count. The crowd leaned short at 62% with sentiment −0.45, but on five posts from four channels and with no levels named. That is a light read: it neither confirms nor contradicts a plan, so the plan rests on structure — on the 4-hour chart, a grade B demand order block just below price, from 4,235.6 to 4,265.0, and a grade A supply block above, from 4,332.4 to 4,366.3. The euro told the same story: mixed at 35% on five posts from three channels.
Five minutes, two different answers. On Bitcoin the crowd showed where not to put a stop; on gold it said almost nothing, which is worth knowing too.
What to Take Away
Analysts on Telegram and X are worth reading for one reason: their followers trade what they post. That makes the crowd's direction and its levels useful context — where orders and stops are likely to sit, and how crowded a view has become. It does not make any of it a trade.
So read the room in one table instead of twenty channels, check the evidence behind the pairs you care about, mark the crowd's levels next to your zones, and give your own plan a verdict: agrees, disagrees, or crowded. Build the trade itself from structure — our fair value gap and order block study shows why the stop, the target and the fees matter more than the entry — and let an alert bring it to you.
This is educational, not financial advice. ProvenAlpha mirrors what public analysts post; the levels and calls are theirs, not ours, and a consensus is not a recommendation. The worked example is a snapshot of live data. HIP-3 markets are perpetual contracts that track a reference price; they are not the underlying securities, commodities or currencies. Always define your invalidation and size positions for risk.