
Here is the routine: open the Opportunity Screener on all 66 markets, sort by volume, keep only the markets whose momentum points your way, check where price sits in its range and what analysts are saying, then let the trade plan decide. Take the setups whose entry, stop and target still add up after fees, set an alert for the ones price has not reached yet, and skip everything else. On most days that leaves two or three trades worth your attention, and it takes about ten minutes.
The last step is strict for a reason. Our fair value gap and order block study, which tracked every zone on 15 crypto markets over two years and re-checked the results on ten coins it had never seen, found that buying the first touch of a zone is roughly a breakeven trade before costs. The screener finds the markets; the trade you build decides whether one is worth taking.
What the Screener Shows, and Why a Routine Beats Scrolling
The screener is one table with one row per market: 43 crypto perpetual futures on Bybit and 23 stock, commodity, index and FX perpetuals on Hyperliquid (the HIP-3 markets — contracts that track Apple, gold or the yen, not the shares or the metal itself). It is free, needs no account and updates every minute.
Each row is split into five column groups, and the routine uses them in order:
- Timeframe alignment — a reading from −1 to +1 on six timeframes and their weighted sum, ∑TF, from −6 to +6.
- Momentum — long-term direction, trend strength (ADX), volume against its average (Vol/MA20), MACD on three timeframes, the momentum scenario, distance from VWAP and volatility (ATR).
- SMC Zones — where price sits in its range, the nearest order blocks and a trade plan: entry, stop, target and reward-to-risk after fees.
- Community · ProvenAlpha — what public Telegram analysts said about the market in the last day.
- Situation — which profile the market fits best: trend, pullback, accumulation or reversal.
That is a lot of numbers for 66 markets, and scrolling through them is how an afternoon disappears. A routine turns the table into a funnel: every step removes markets, so by the time you open a chart you are looking at a handful that passed every test.
The Ten-Minute Routine, Step by Step
Step 1 — Start With All 66 Markets
Pick the All 66 tab, not Crypto. The best move of the day is just as likely to be in silver, oil or a US stock as in a coin, and the same columns read the same way on every market.
Step 2 — Sort by Vol/MA20 to Find the Activity
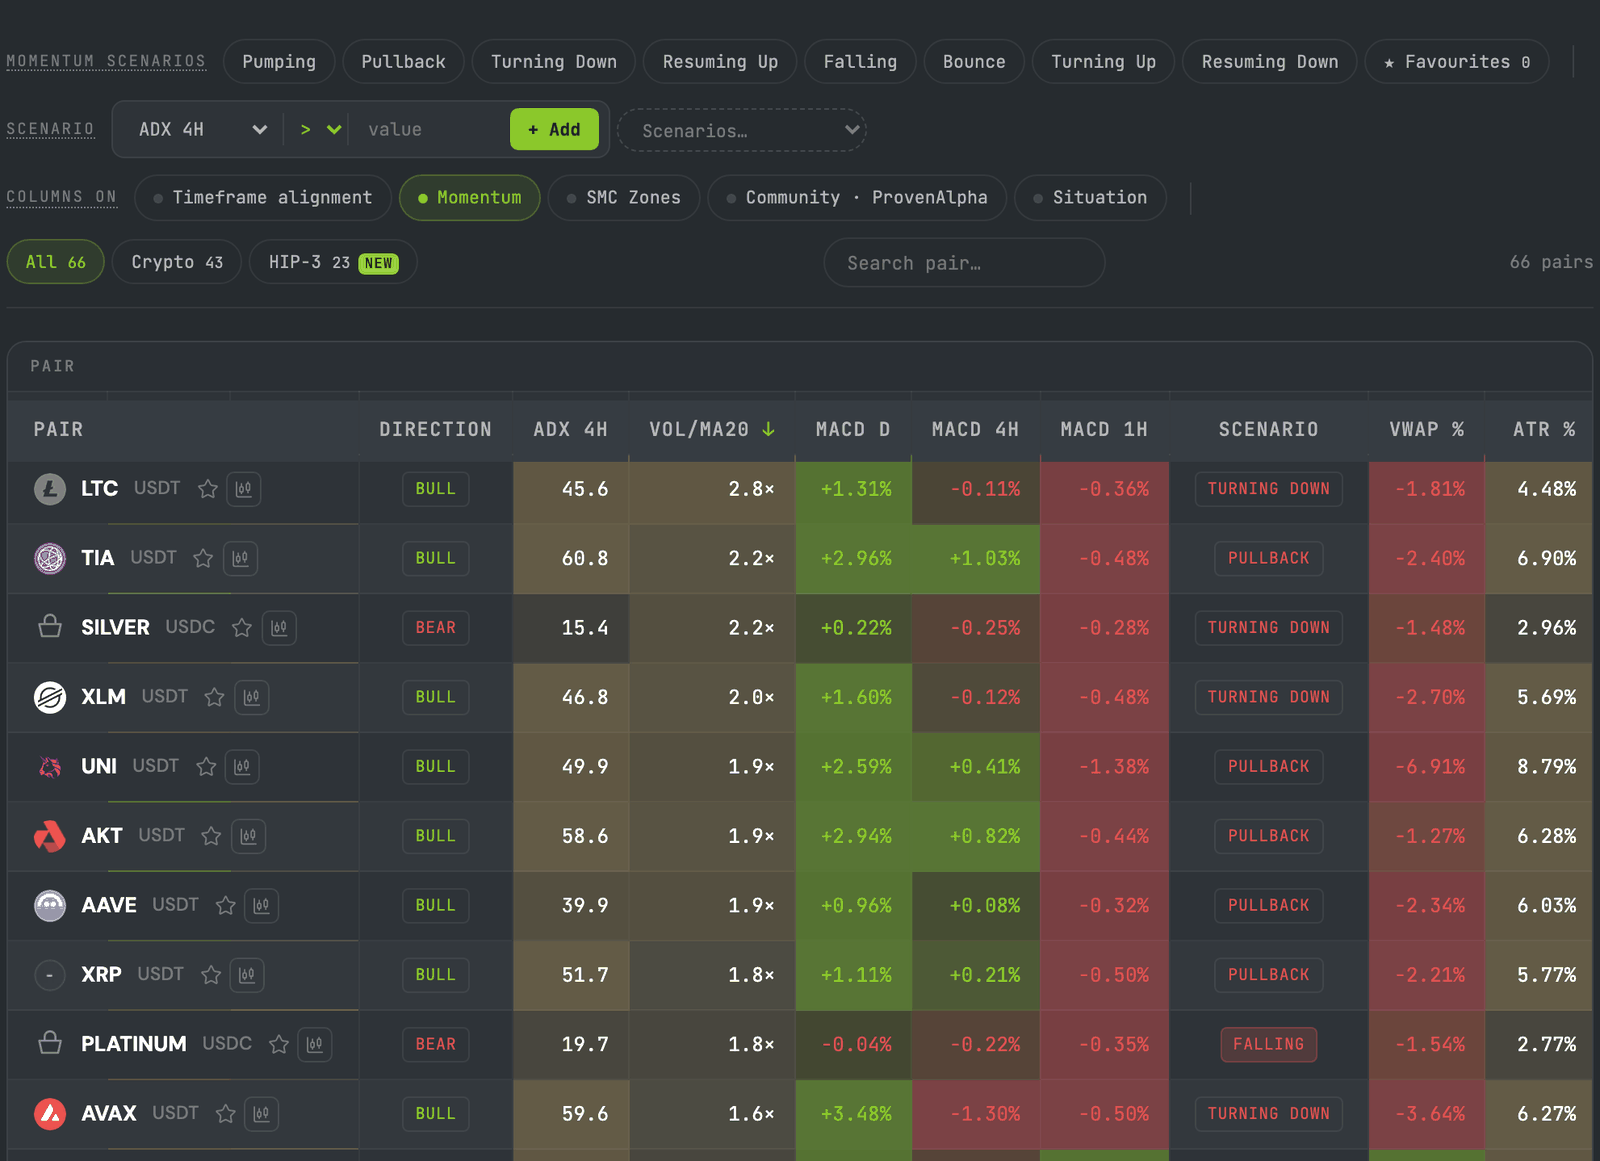
Click the Vol/MA20 header. It divides current volume by its 20-period average, so 1.0× is an ordinary day and 2.0× is twice the usual activity. The top of the list is where traders are showing up today.
Look for: the markets above 1×. Skip: the quiet end of the list — a setup with no participation behind it has nobody to carry it.
Step 3 — Keep the Momentum That Points Your Way
The MACD histogram on the daily, 4-hour and 1-hour charts says which way momentum points on each. A turn shows on the 1-hour first, then the 4-hour, then the daily, so the pattern of signs tells you how far a move has run. The screener names the eight patterns in its Scenario column and in the Momentum scenarios pills above the table:
| Scenario | D | 4H | 1H | Reading |
|---|---|---|---|---|
| Pumping | + | + | + | Uptrend, all agree |
| Pullback | + | + | − | Shallow dip in an uptrend |
| Turning Down | + | − | − | Deeper drop, daily not yet |
| Resuming Up | + | − | + | Dip ending |
| Falling | − | − | − | Downtrend, all agree |
| Bounce | − | − | + | Shallow rally in a downtrend |
| Turning Up | − | + | + | Possible reversal, daily not yet |
| Resuming Down | − | + | − | Bounce ending |
Sign of the MACD histogram on the daily (D), 4-hour and 1-hour charts. The Scenario column shows the pattern for every market; a pill keeps only the markets in that pattern.
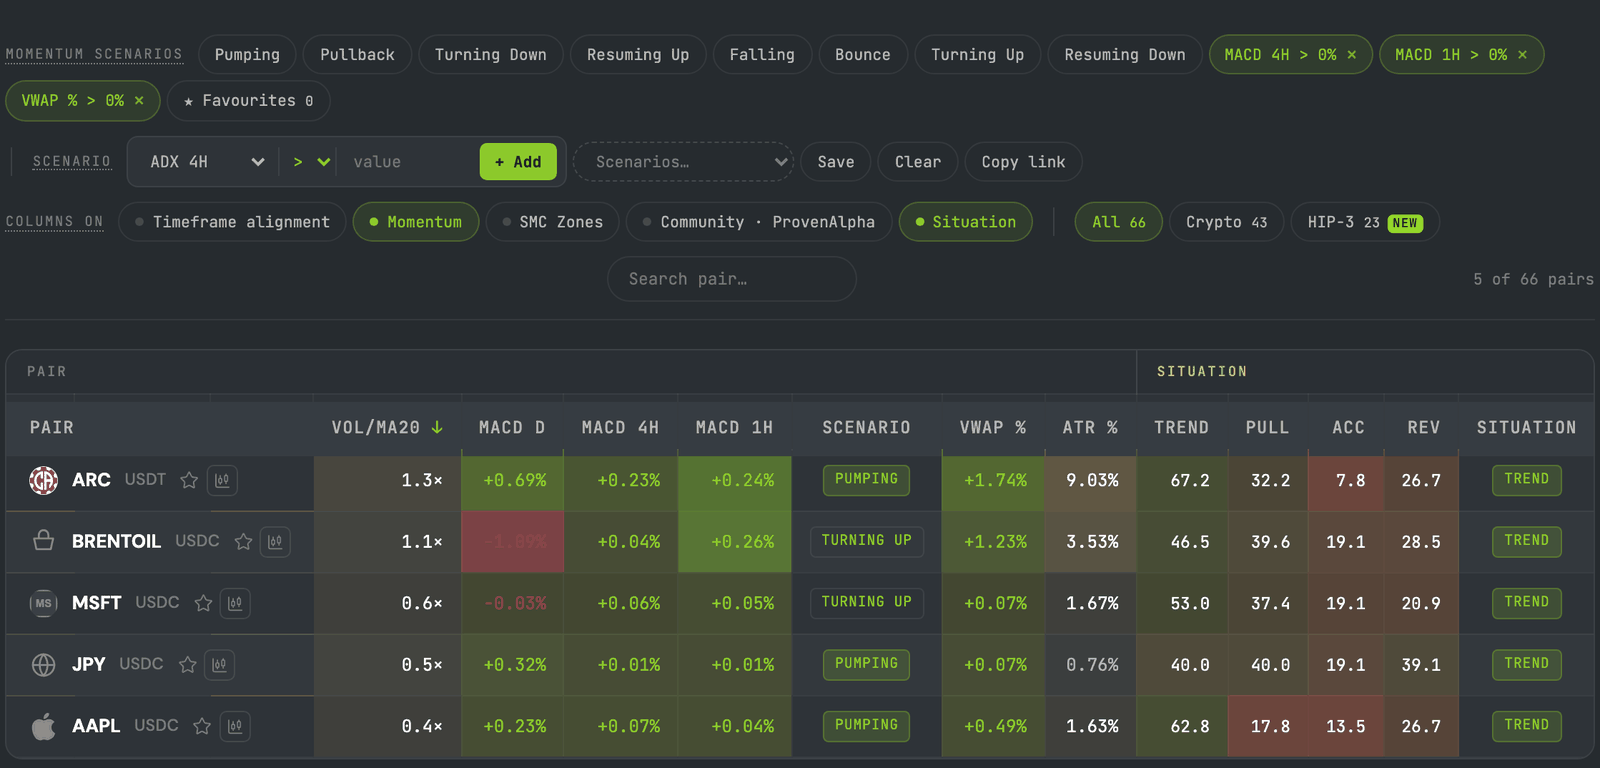
A pill shows one pattern at a time. For a long screen that keeps every market with momentum behind it, build it from conditions instead: in the Scenario row add MACD 4H > 0, MACD 1H > 0 and VWAP % > 0. Conditions combine with AND, so a market has to pass all three: momentum up on the 4-hour and the 1-hour, and price above the session's volume-weighted average. That keeps Pumping and Turning Up together. For shorts, flip each condition to < 0. The conditions travel in the address, so this link opens the long screen ready-made.
Confirm with the Situation badge and the timeframe alignment. A Pumping market with a Trend badge, a Bull direction and a strongly positive ∑TF has every layer agreeing. A Turning Up market in a Bear direction is a different trade: you are betting the daily will follow, so it deserves a smaller size or a wait.
Skip: markets whose momentum points against your direction, and markets where the Scenario column shows a dash — one of the three readings is missing.
Step 4 — Check the Zone: Premium or Discount
The Zone column places price inside the range between its key support and resistance. Premium and High Premium are the upper half, Discount and High Discount the lower half, and Above R or Below S means price has left the range. The smart-money framing is to buy in discount and sell in premium.
We have not measured how often that framing pays, so use the column as context rather than a rule. A long in High Premium is a long close to resistance: the target is near, so the trade plan in step 6 has to show it is still worth taking.
Step 5 — Read the Room With Community · ProvenAlpha
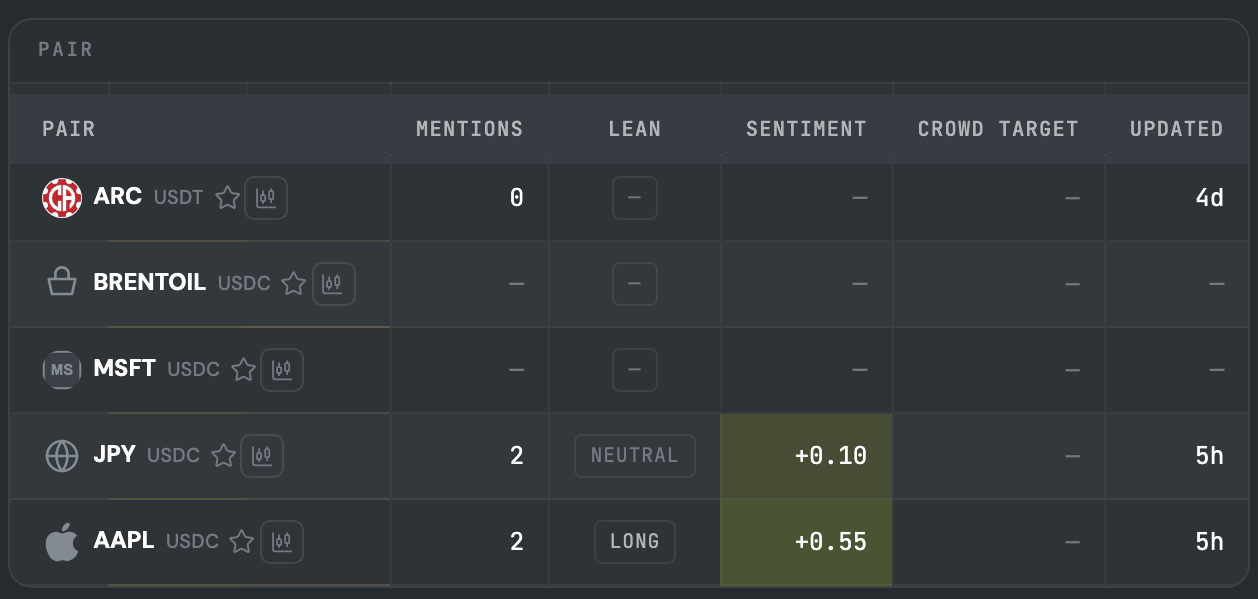
The Community columns show what public Telegram analysts said about the market in the last day: how many mentions, which way they lean, their sentiment and the average target they named. It comes from the same read that powers ProvenAlpha, which covers the markets analysts talk about, some HIP-3 markets included, and stays blank elsewhere.
Treat it as context, not a vote. Analysts agreeing with you is a mild confirmation; a crowd leaning hard the same way is a reason to ask where their stops sit. A blank cell means nobody is talking about the market, which is neither good nor bad.
Step 6 — Design the Entry, or Set an Alert
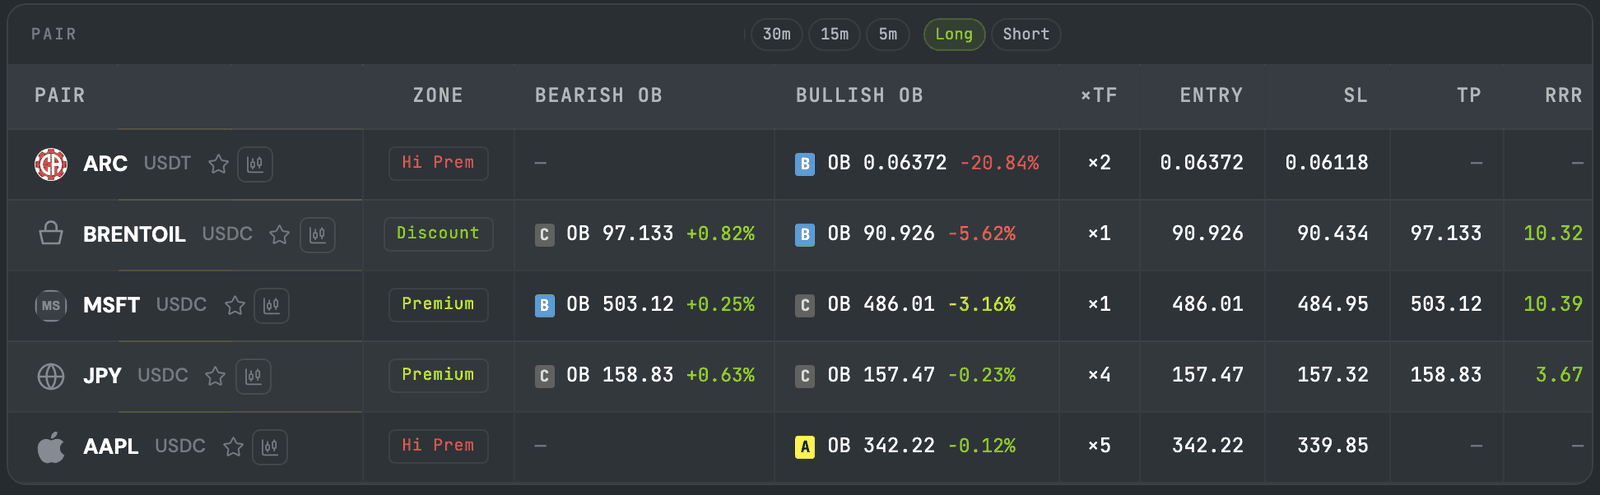
Choose the zone timeframe and the side (Zones on 4H, Long) and read the SMC Zones columns. The bullish order block is where the entry would be, graded A to C by size against volatility; ×TF counts how many timeframes have a zone at the same price; Entry, SL and TP are the near edge of that zone, its far edge and the first opposing zone; RRR is the reward-to-risk after taker fees on both sides. Then click the chart icon to see the zones on ZoneHunter Live.
Take it when price is at the zone and the plan is complete: a target exists, the stop has room, and the RRR justifies the risk. Skip when the TP and RRR cells are blank (no opposing zone to aim at) or when the stop sits closer than about 0.3% to the entry — ordinary noise reaches a stop that thin before the trade can work. And when price has not reached the zone yet, do not chase it: set a free zone alert and let the market come to you.
The rule is strict for a reason. In our study, buying the first touch of a grade A zone with the stop beyond it and a 3:1 target won between 20.0% and 29.2% of the time across fair value gaps and order blocks on every timeframe, on the ten crypto coins held out of the analysis — against the 25% a 3:1 trade needs just to break even, before fees and slippage. The zone gives you a place to act; the stop, the target and the costs decide the result. How to choose the timeframe for your zones goes deeper on sizing the stop against the fees.
A Worked Example: 23 September 2026
An example of the routine, not a call. This is the screener as it stood at 13:27 UTC on 23 September 2026, long side, 4-hour zones. The numbers have moved since.
Steps 1 to 3 cut 66 markets to five: ARC, Brent oil, Microsoft, the yen and Apple — one coin and four HIP-3 markets. Step 6 then sorted them:
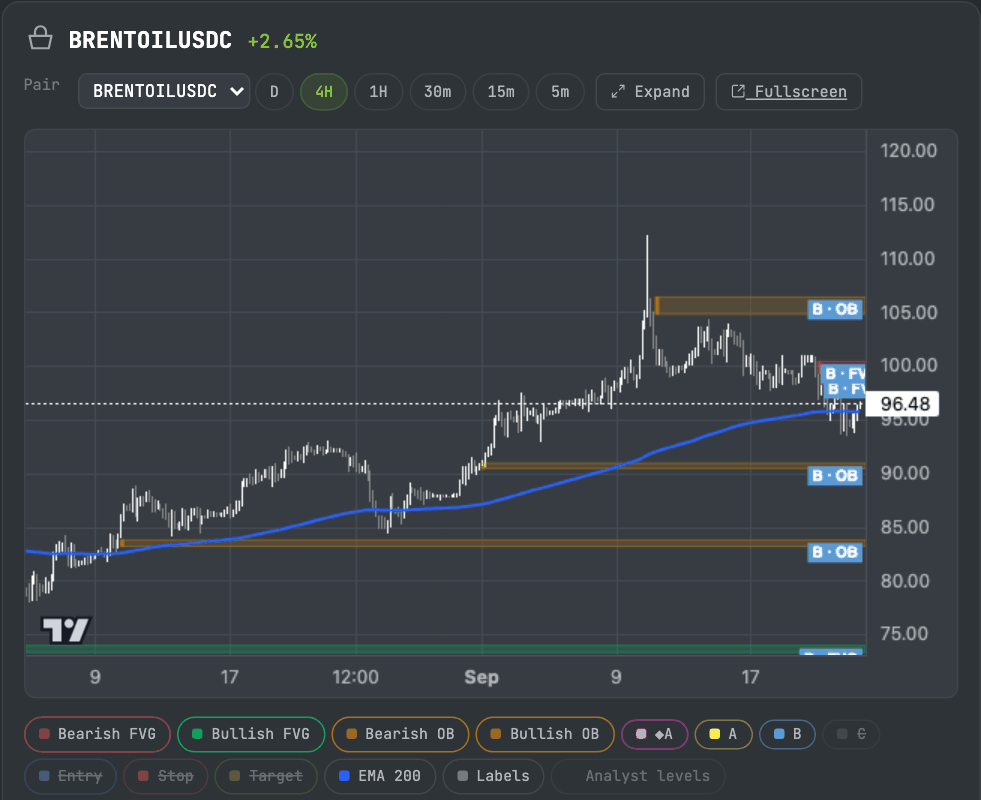
- Brent oil — a complete plan, counter-trend. Discount zone, a grade B bullish order block 5.62% below price, entry 90.926, stop 90.434 (0.54% away), target 97.133, RRR 10.32 after fees. But the scenario is Turning Up with the daily MACD at −1.09% and the direction Bear: a bet that the daily turns. Worth taking at the zone, at a smaller size — an alert, not a market order.
- Apple — every layer agrees, no target. Pumping, ∑TF +3.9, direction Bull, a grade A order block at 342.22 just 0.12% below price with zones stacked on five timeframes (×5), and two analyst mentions leaning long. The TP and RRR cells are blank: there is no bearish zone above to aim at. Worth an alert at 342.22 if you are prepared to manage the exit yourself; otherwise skip.
- ARC — the zone is far away. Pumping, but in High Premium with the nearest bullish order block about 21% below. Nothing to do today except set an alert.
- Microsoft and the yen — stops too thin. Their stops sat 0.22% and 0.10% from the entry, under the 0.3% line. Skip, or widen the stop and accept a smaller RRR.
Ten minutes, and the answer is three markets worth trading, none of them at the price right now. That is a normal outcome: the routine's job is to tell you where to wait, and the alert does the waiting.
What to Take Away
A screener is only as useful as the order you read it in. Start wide, so you do not miss the market that is moving today. Narrow by activity and momentum, so you only look at markets with participation and direction. Use the zone and the crowd as context. Then let the trade plan make the final cut, because the entry alone is not an edge — the stop, the target and the fees are.
Run the six steps once a day, take the setups that are ready, set alerts for the ones that are not, and close the table. Two or three good trades a day is plenty.
This is educational, not financial advice. The worked example is a snapshot of live data, not a recommendation. The study figures come from past data on 15 crypto markets, measured before slippage. HIP-3 markets are perpetual contracts that track a reference price; they are not the underlying securities or commodities. Always define your invalidation and size positions for risk.