
Some fair value gaps turn price away far more often than others, and you can read which ones before price ever arrives. The tell is size relative to volatility. We measured it on 15 crypto markets and four timeframes, and large gaps were rejected more often than small ones on every one.
Updated 15 September 2026: what we measured next. In June this page reported an expected value of about +0.48R for grade A gaps at a 2:1 target. Our June measurements hold up: re-run on the same settings, grade A gaps held 53.1% of the time against the ~53% we published. What we improved is the inference. That figure credited every gap that did not fully fill with capturing the whole reward, with no stop, no target and no intrabar path, so it described whether a zone survived, not what a trade on it returns.
Our September study simulates the trade itself, with entry, stop, target, path and fees: How to Turn Fair Value Gaps Into High-Quality Trades. This page now reports how zones behave, re-measured on 15 coins and four timeframes.
Step 1: Grade Every Gap by Size
If you're new to the concept, our companion guide covers how Fair Value Gaps actually work. Here we're focused on one thing: reading how a gap is likely to behave. The single biggest tell is size relative to volatility.
Divide a zone's size by ATR(14) and you get a grade:
- Grade A (≥ 1.0× ATR): a large imbalance for current conditions
- Grade B (≥ 0.5× ATR): moderate
- Grade C (< 0.5× ATR): minor
Grading against ATR rather than a fixed price distance makes the measure comparable across assets and across calm and volatile markets.
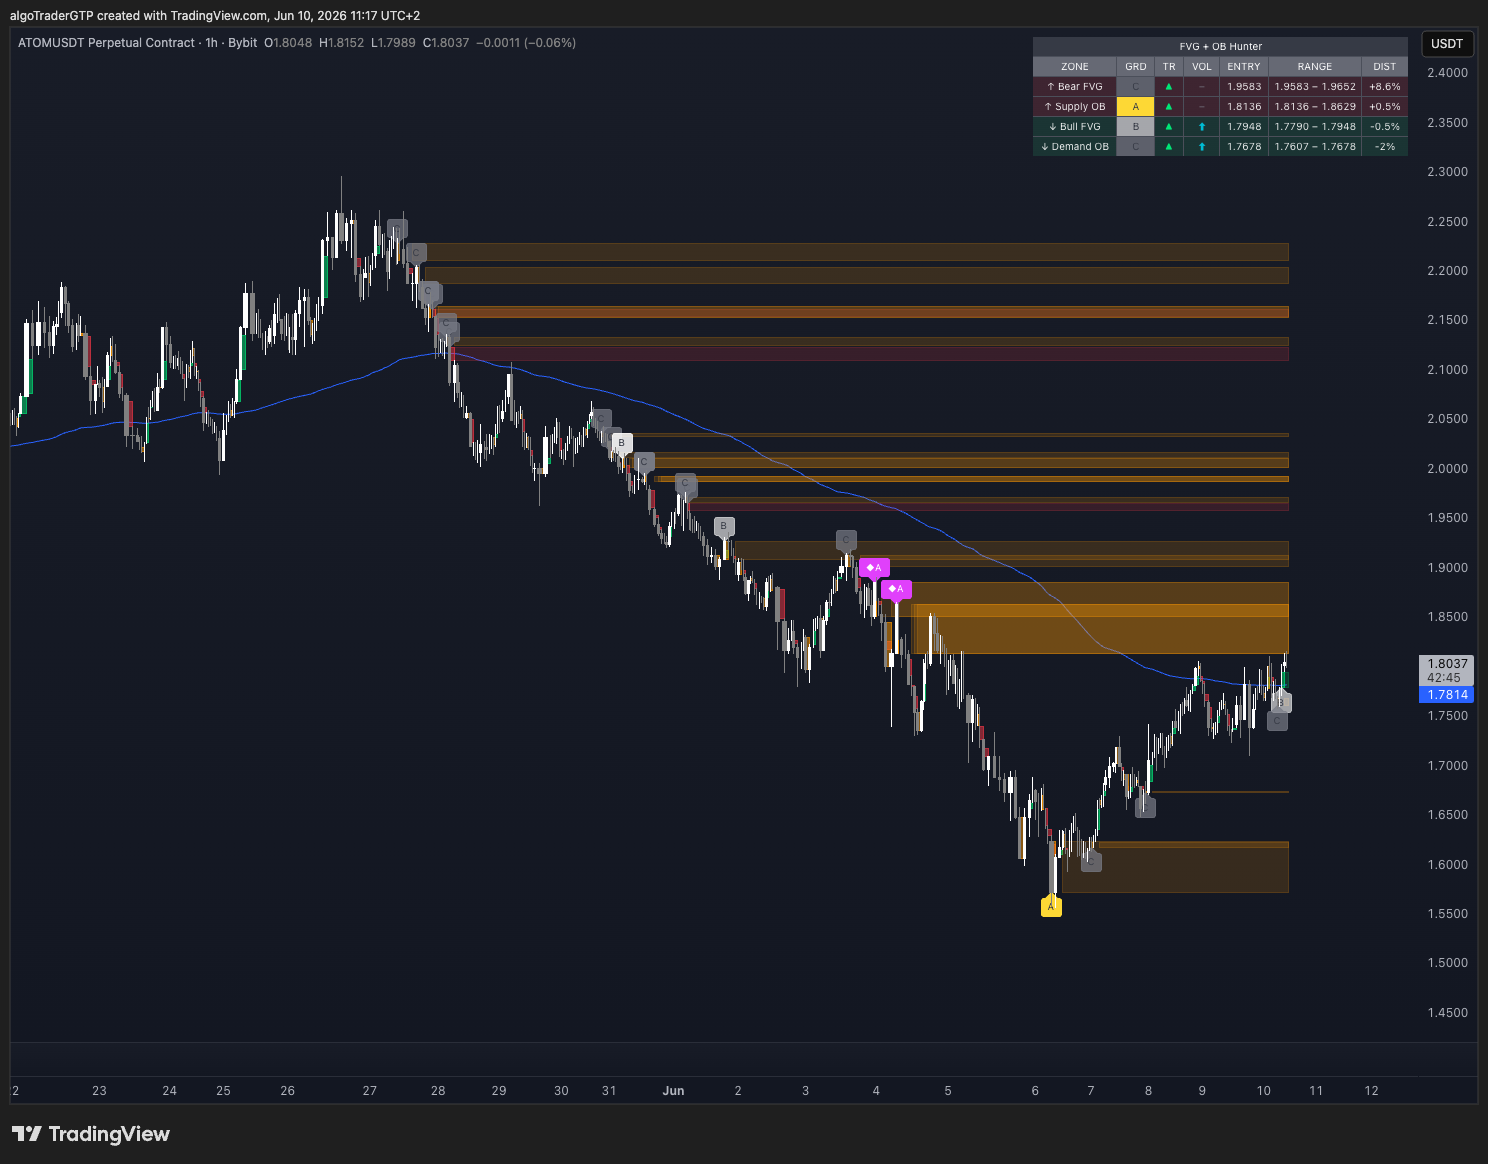
How Often Price Rejects Each Grade
We followed every zone for 200 candles and recorded the first thing that happened:
- Rejected: price touched the zone, then closed back out on the side it came from, before any candle closed through it. ZoneHunter Pro calls this “mitigated”.
- Invalidated: a candle closed through the far edge first.
- Never reached: price did not come back within 200 candles.
| Fair value gaps, rejected | 15m | 1h | 4h | 1D |
|---|---|---|---|---|
| Grade A | 75.6% ± 0.4 | 76.7% ± 0.7 | 74.0% ± 1.4 | 79.4% ± 2.3 |
| Grade B | 69.2% ± 0.2 | 70.6% ± 0.5 | 70.9% ± 1.0 | 74.0% ± 1.4 |
| Grade C | 57.5% ± 0.1 | 58.7% ± 0.3 | 58.9% ± 0.5 | 57.7% ± 0.8 |
| Grade A invalidated | 17.2% ± 0.3 | 16.3% ± 0.6 | 19.2% ± 1.2 | 15.0% ± 2.0 |
| Grade C invalidated | 37.6% ± 0.1 | 36.1% ± 0.3 | 36.0% ± 0.5 | 36.5% ± 0.8 |
| Zones measured (A / B / C) | 13,081 / 42,593 / 157,167 | 3,403 / 8,684 / 35,840 | 1,012 / 2,192 / 8,751 | 321 / 976 / 3,561 |
Share of zones ± one standard error · all 15 coins · the rest of each grade was never reached.
Order blocks follow the same ordering:
| Order blocks, rejected | 15m | 1h | 4h | 1D |
|---|---|---|---|---|
| Grade A | 73.4% ± 0.3 | 70.4% ± 0.7 | 74.0% ± 1.4 | 70.5% ± 2.9 |
| Grade B | 66.9% ± 0.2 | 67.0% ± 0.4 | 65.0% ± 1.0 | 68.9% ± 1.5 |
| Grade C | 55.4% ± 0.1 | 56.1% ± 0.3 | 55.2% ± 0.5 | 55.7% ± 0.8 |
| Grade A zones measured | 17,293 | 3,732 | 958 | 244 |
Outcomes applied to the order block’s body · all 15 coins.
Every result was formed on five coins (BTC, ETH, SOL, BNB, XRP) and confirmed on ten more that played no part in forming it:
| Rejected: held-out / study coins | 15m | 1h | 4h | 1D |
|---|---|---|---|---|
| Fair value gap, grade A | 76.0 / 75.0 | 76.2 / 77.8 | 74.1 / 73.9 | 82.4 / 75.0 |
| Fair value gap, grade B | 68.7 / 70.4 | 70.9 / 70.0 | 71.6 / 69.5 | 75.2 / 72.0 |
| Fair value gap, grade C | 57.3 / 58.1 | 58.6 / 58.9 | 59.0 / 58.6 | 58.4 / 56.4 |
| Order block, grade A | 72.6 / 75.1 | 70.3 / 70.7 | 73.1 / 76.0 | 68.4 / 74.4 |
| Order block, grade B | 66.6 / 67.5 | 66.3 / 68.5 | 66.3 / 62.5 | 71.1 / 64.8 |
| Order block, grade C | 55.1 / 56.0 | 55.6 / 57.1 | 54.1 / 57.5 | 57.3 / 52.8 |
Percent of zones rejected · held-out: ADA, AVAX, LINK, DOGE, DOT, LTC, ATOM, NEAR, APT, ARB.
How to read a rejection rate. The grade ordering is partly geometry: a zone taller than one ATR needs a bigger candle to close through it. And a rejection is usually immediate: 62–66% of grade A rejections, and 82–86% of grade C rejections, happen on the very first candle that touches the gap. A rejection shows where price reacts; it is where a trade begins, and our trade study measures what comes next.
Every Timeframe Runs on the Same Clock
Counted in candles, zones behave alike on every timeframe. Price typically reached a fair value gap within two candles whether the chart was 15-minute or daily. In clock time that is 30 minutes on a 15-minute chart, 2 hours on 1-hour, 8 hours on 4-hour and 2 days on a daily chart. None of the 24 timeframe comparisons we registered in advance showed a difference that replicated on the held-out coins.
Measure in hours instead and a difference does appear, for a simple reason: over the same 8.3 days a 4-hour zone gets 50 candles and a 15-minute zone gets 800, so the 4-hour zone has had fewer chances to resolve (3 to 15 points less often rejected in that window). The practical takeaway is freeing: pick your timeframe for your holding period and your fees. Zone size grows with timeframe, so fees are a much smaller share of the risk on higher timeframes; the trade study has the numbers. Every table on this page is downloadable as open CSV data on our research data page.
A Gap With an Order Block Behind It Is Rejected at the Same Rate
An Order Block is the last opposing candle before a strong move. When its candle sits within three candles of a fair value gap, the two often get treated as a stronger setup. On rejection rate, they are the same zone: grade A gaps with an order block right behind them were rejected within about two points of grade A gaps without one (held-out coins: −0.4 ± 0.9 points on 15-minute charts, −1.6 ± 1.8 on 1-hour; grade B +0.4 ± 0.6 and −0.4 ± 1.2). No direction replicated on 4-hour or daily charts either.
That makes the order block useful context for where a move started, while the grade remains the measure that separates how zones behave.
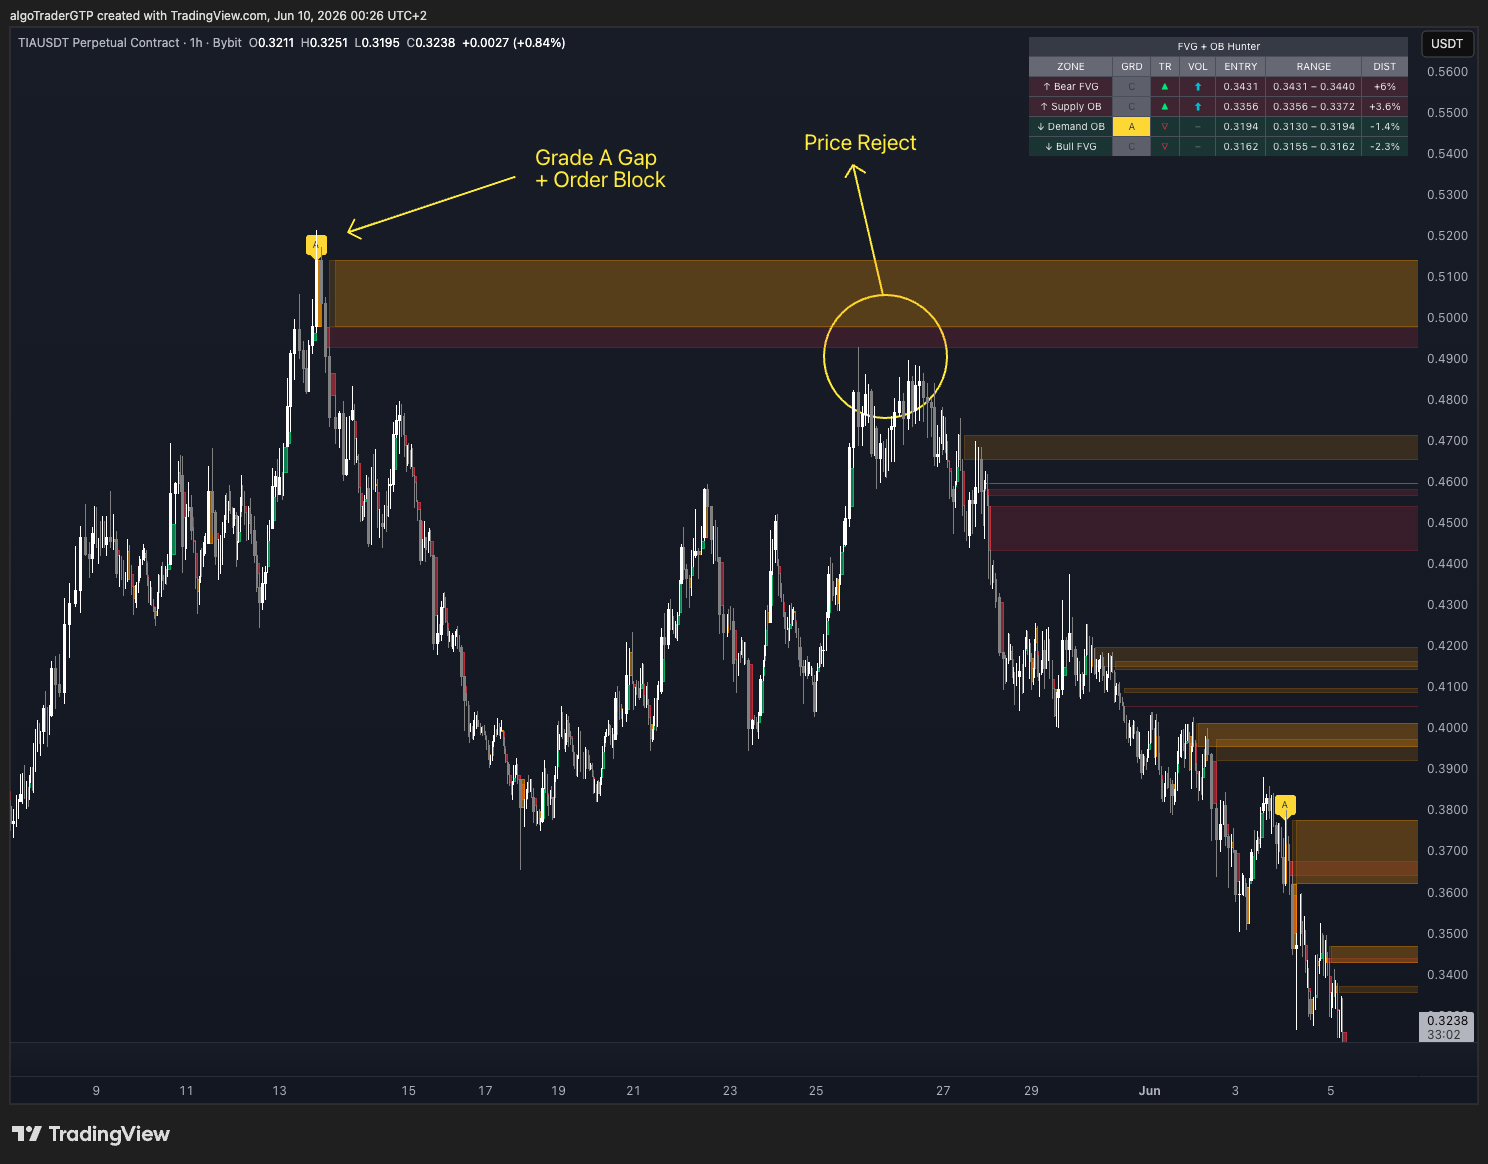
From a Rejection to a Trade
We tested fair value gaps and order blocks on 15 crypto markets over two years, and re-checked every result on ten coins we never used to form an idea. The zones are real: price usually reacts at them, and the strongest are rejected about three times in four, often on the very first candle. A reaction is where a trade begins. Buying the first touch reached a 3:1 target only about as often as breaking even requires, on every timeframe and filter we tested, which shows where the real work is. What decides the outcome is how the trade is built: the entry, the stop, the target and the costs. ZoneHunter Pro finds and grades the zones exactly as we measured them; TradePlanner Pro helps you build the trade around them.
How We Automate It
Grading every gap by ATR, finding the Order Block behind it, and tracking which zones are still live across multiple timeframes is more than you can do by hand in real time. That's exactly what we built ZoneHunter Pro to do:
- Detects every Bullish and Bearish Fair Value Gap the moment it forms, with the same logic this study measured
- Identifies the Supply or Demand Order Block alongside each gap
- Grades every zone A / B / C by size relative to ATR, so you see at a glance how a zone is likely to behave
- Highlights grade A zones that are also trend-aligned and volume-elevated
- Shows the nearest active zones above and below price in a live table, with grade, entry, range and distance
- Fires alerts when a zone forms, when price enters, and when it's mitigated
It runs on TradingView. To plan the trade around a zone, TradePlanner Pro lays out entry, take-profit, stop-loss and fees on the same chart.
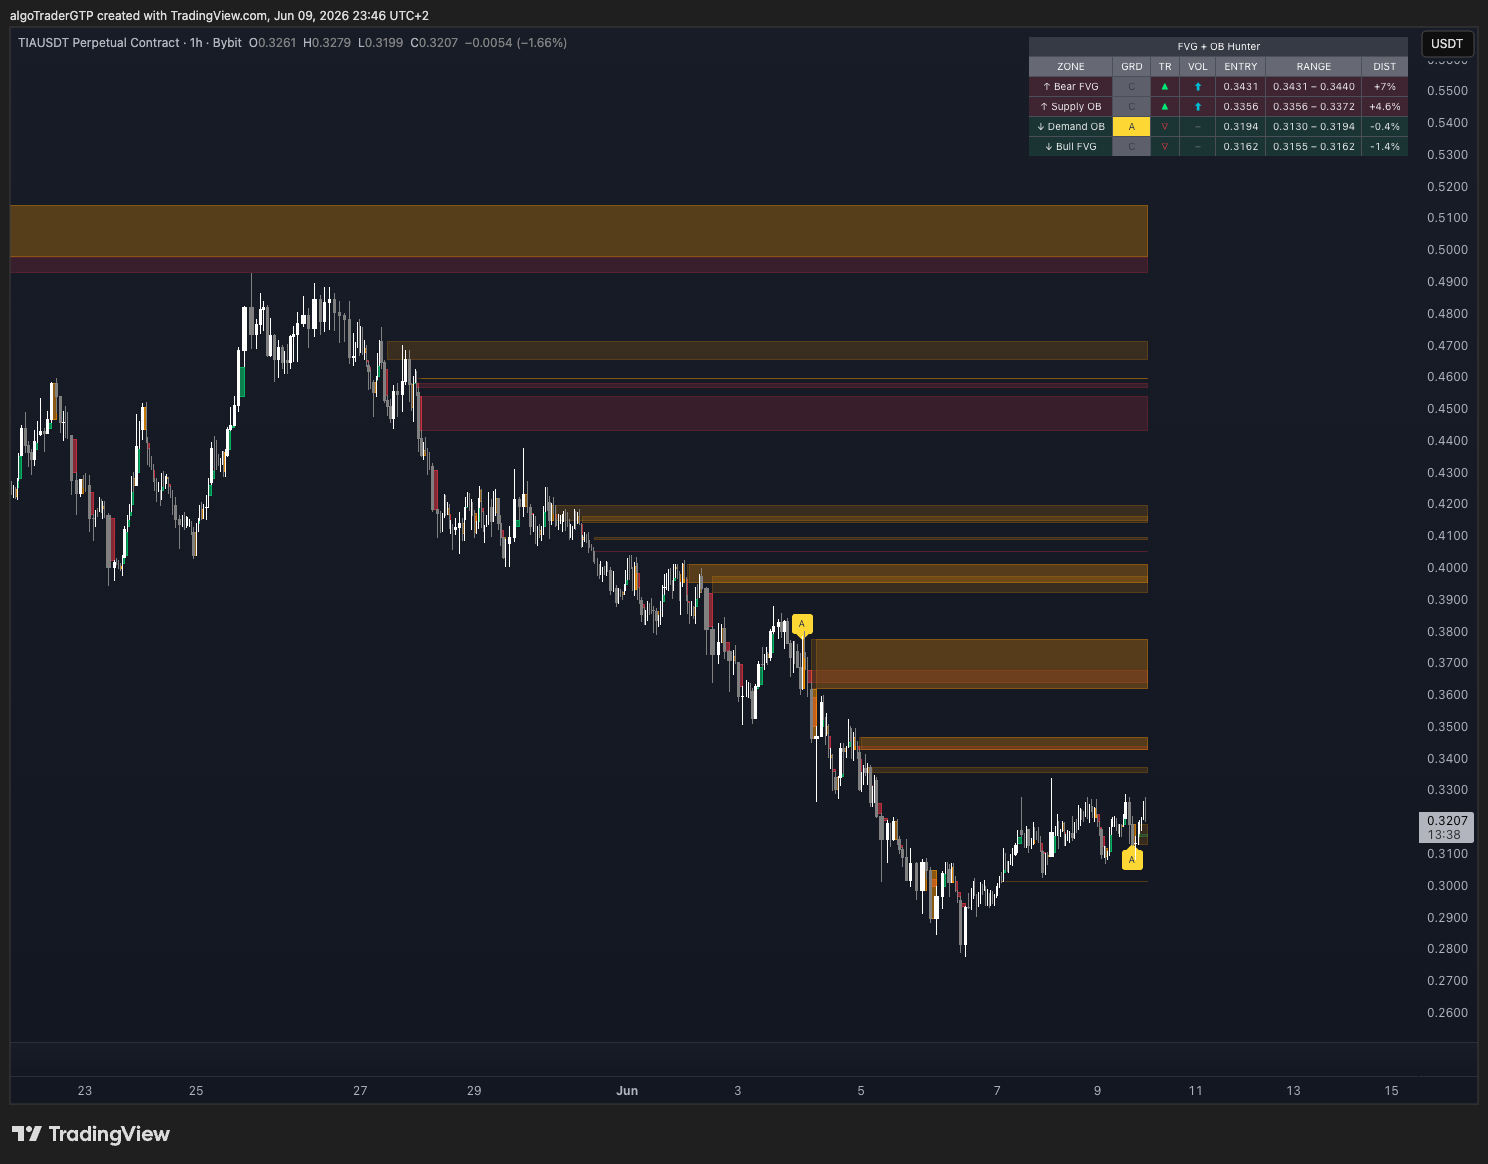
How We Measured It
15 Bybit USDT perpetual futures: BTC, ETH, SOL, BNB and XRP to form every idea; ADA, AVAX, LINK, DOGE, DOT, LTC, ATOM, NEAR, APT and ARB held out to confirm. 15-minute, 1-hour and 4-hour candles from 20 September 2024 to 12 September 2026; daily candles over each coin's full Bybit history. Zones detected exactly as ZoneHunter Pro's Pine script draws them (11 of 11 components verified), graded by height ÷ ATR(14), and followed for 200 candles; zones whose window runs past the end of the data are excluded. Standard error = √(p(1 − p) ÷ n). Zones overlap in time and the coins move together, so treat each standard error as a lower bound. The full methodology, including detection rules and how results were confirmed, is in the trade study. Download the data free (CC BY 4.0) on the research data page.
Prefer to Follow Along?
The free AlgoTraderPro Telegram channel posts the setups the desk takes. See how the signals work.
This is educational, not financial advice. Backtested statistics describe historical zone behavior and do not predict future results. Nothing here is a recommendation to buy or sell any asset. Manage risk and size positions accordingly.
Disclosure: some links above are affiliate or product links — if you buy through them, AlgoTraderPro may earn a commission at no extra cost to you.